Nordic American Tankers (NAT) Valuation Check After $25 Million Debt Free Tanker Sale And Fleet Renewal Moves
Nordic American Tankers Limited NAT | 6.15 | +7.33% |
Nordic American Tankers (NAT) has drawn fresh attention after agreeing to sell a 2003-built Suezmax tanker for US$25 million, with no debt on the vessel, as part of its fleet renewal plans.
These fleet moves come as the share price sits at US$4.54, with a 30-day share price return of 11.82% and a 90-day gain of 22.04%. The 1-year total shareholder return of 93.18% and 5-year total shareholder return of 104.90% point to stronger, longer term momentum.
If this tankers story has you thinking about where else capital might flow next, it could be worth scanning our 25 power grid technology and infrastructure stocks as another way to uncover infrastructure related opportunities.
With Nordic American Tankers trading near its analyst price target and recent returns looking strong, the key question now is simple: is the stock still undervalued or is the market already pricing in future growth?
Preferred Price-to-Sales of 3.3x: Is it justified?
On Simply Wall St's data, Nordic American Tankers is trading on a P/S of 3.3x, which screens as expensive relative to both peers and an estimated fair level.
The P/S ratio compares the company’s market value to its revenue, so a higher figure usually means investors are paying more for each dollar of sales. For a tanker business, where earnings and cash flows can move around with freight rates and charter conditions, this kind of premium often implies the market is assigning extra value to future profitability rather than current margins.
Here, the 3.3x P/S stands well above the peer average of 1.5x and the wider US Oil and Gas industry average of 1.6x. This means the stock is valued at more than double what many similar businesses trade at. Against an estimated fair P/S of 0.7x, the gap is even wider, suggesting the multiple could have room to compress if expectations cool and pricing moves closer to that fair ratio level.
Result: Price-to-Sales of 3.3x (OVERVALUED)
However, the annual revenue growth decline of 7.05% and the large gap to the estimated fair P/S of 0.7x both leave limited room if sentiment cools.
Another View: Our DCF Model Points in the Same Direction
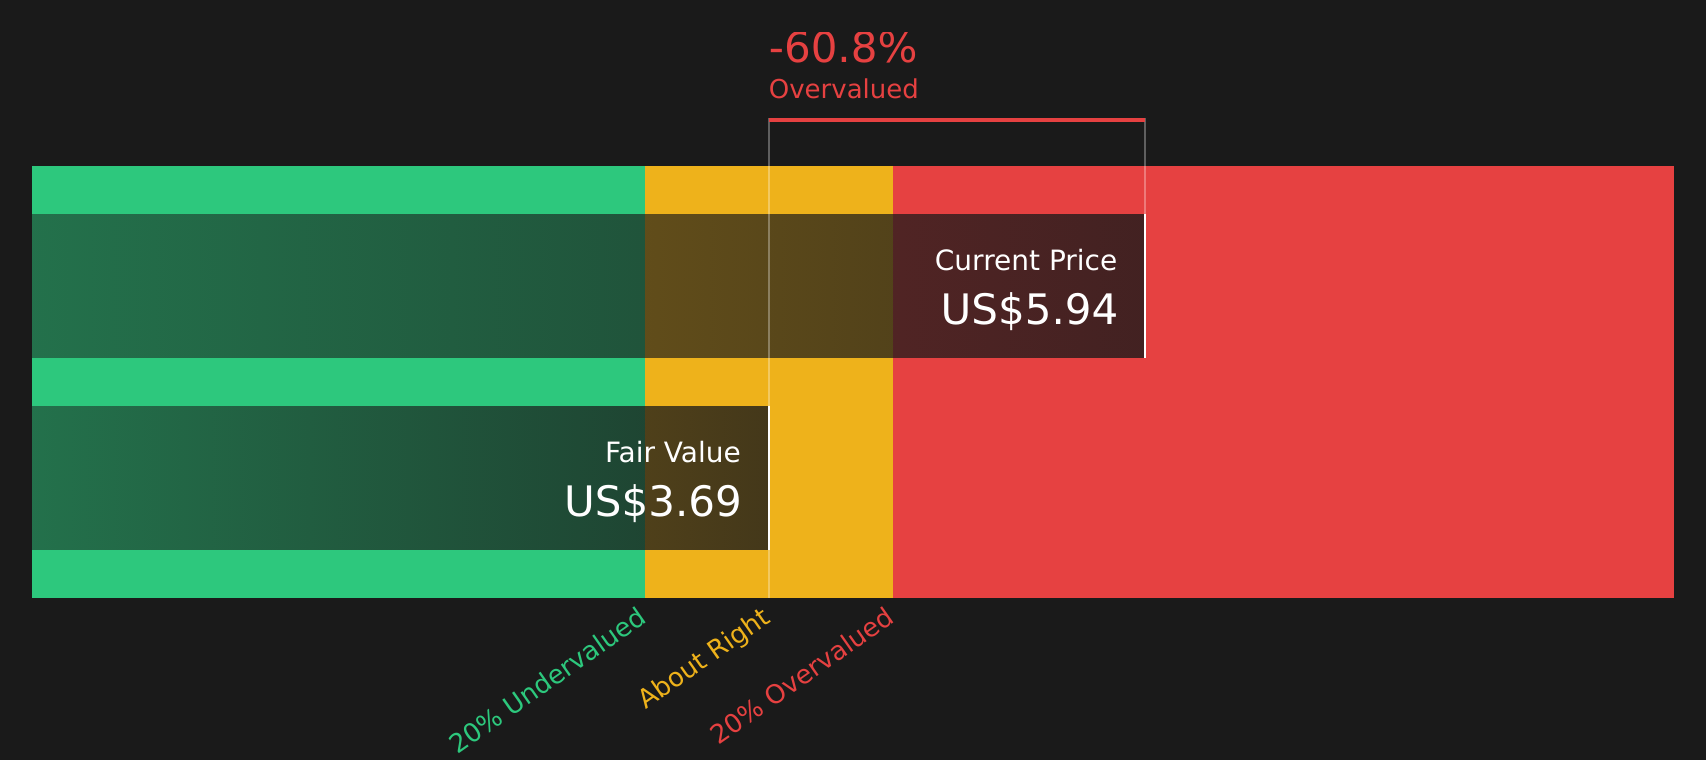
While the 3.3x P/S already appears high relative to peers, our DCF model does not provide an offsetting view. Based on Simply Wall St's figures, Nordic American Tankers is trading at $4.54 compared with an estimated future cash flow value of $2.86, which also suggests overvaluation.
Simply Wall St performs a discounted cash flow (DCF) on every stock in the world every day (check out Nordic American Tankers for example). We show the entire calculation in full. You can track the result in your watchlist or portfolio and be alerted when this changes, or use our stock screener to discover 53 high quality undervalued stocks. If you save a screener we even alert you when new companies match - so you never miss a potential opportunity.
Build Your Own Nordic American Tankers Narrative
If you see the numbers differently or simply prefer to work through the data yourself, you can build your own view in a few minutes using Do it your way.
A great starting point for your Nordic American Tankers research is our analysis highlighting 1 key reward and 4 important warning signs that could impact your investment decision.
Looking for more investment ideas?
If Nordic American Tankers caught your eye, do not stop here. Broaden your watchlist with a few carefully filtered ideas that could sharpen your next move.
- Target quality at a discount by scanning our 53 high quality undervalued stocks, so you are not relying on just one company to carry your portfolio.
- Identify potential income streams by reviewing the 13 dividend fortresses, so you can look for yield opportunities early.
- Prioritize resilience by checking the 85 resilient stocks with low risk scores, so you are not caught off guard when conditions change.
This article by Simply Wall St is general in nature. We provide commentary based on historical data and analyst forecasts only using an unbiased methodology and our articles are not intended to be financial advice. It does not constitute a recommendation to buy or sell any stock, and does not take account of your objectives, or your financial situation. We aim to bring you long-term focused analysis driven by fundamental data. Note that our analysis may not factor in the latest price-sensitive company announcements or qualitative material. Simply Wall St has no position in any stocks mentioned.