

Northrop Grumman (NOC) After Supplier Award Recognition And A Pullback That Raises Value Questions
Northrop Grumman Corp. NOC | 0.00 |
Northrop Grumman (NOC) recently recognized Qorvo with a 2026 Supplier Excellence Award for Strategic Excellence, highlighting how key suppliers support the company’s next generation aircraft, missile defense and space programs.
Despite the supplier recognition, Northrop Grumman’s recent share price momentum has eased, with the stock down over the past quarter while the 1-year total shareholder return of 5.6% and 5-year total shareholder return of 65.5% remain positive.
If this kind of defense exposure interests you, it could be a useful moment to look across the broader sector using the 34 power grid technology and infrastructure stocks
After a sharp pullback over the past quarter, Northrop Grumman now sits at a modest intrinsic value discount and below average analyst targets, so the key issue is whether most of the upside still lies ahead or already sits in the rearview mirror.
Price to earnings for Northrop Grumman, is the discount justified?
On a simple snapshot, Northrop Grumman trades on a P/E of 16.8x while its fair P/E is estimated at 28.1x, suggesting the current share price implies a lower earnings multiple than those reference levels.
The P/E ratio compares what you are paying per share to the company’s earnings per share, and for an established defense contractor like Northrop Grumman it often reflects how the market is weighing earnings quality, contract visibility and capital intensity.
Here, a 16.8x P/E sits well below the estimated fair P/E of 28.1x, as well as below the US Aerospace & Defense industry average of 40x and a peer average of 29.5x. This is a wide gap for a company with high quality earnings and a 26.7% return on equity. The market could, in time, choose to narrow or keep this gap in place depending on its view of future growth, debt and cash flow resilience.
Result: Price-to-earnings of 16.8x (UNDERVALUED)
However, Northrop Grumman still faces risks, including contract or budget pressures on its core US programs, and the recent 20.3% three month share price decline dampening sentiment.
Another view on Northrop Grumman’s value
While the P/E work suggests Northrop Grumman looks inexpensive against peers, the SWS DCF model shows the stock at $541.82 versus an estimated future cash flow value of $561.35, a modest 3.5% gap. That still points to some upside, but it may not fully compensate for debt and defense budget risk.
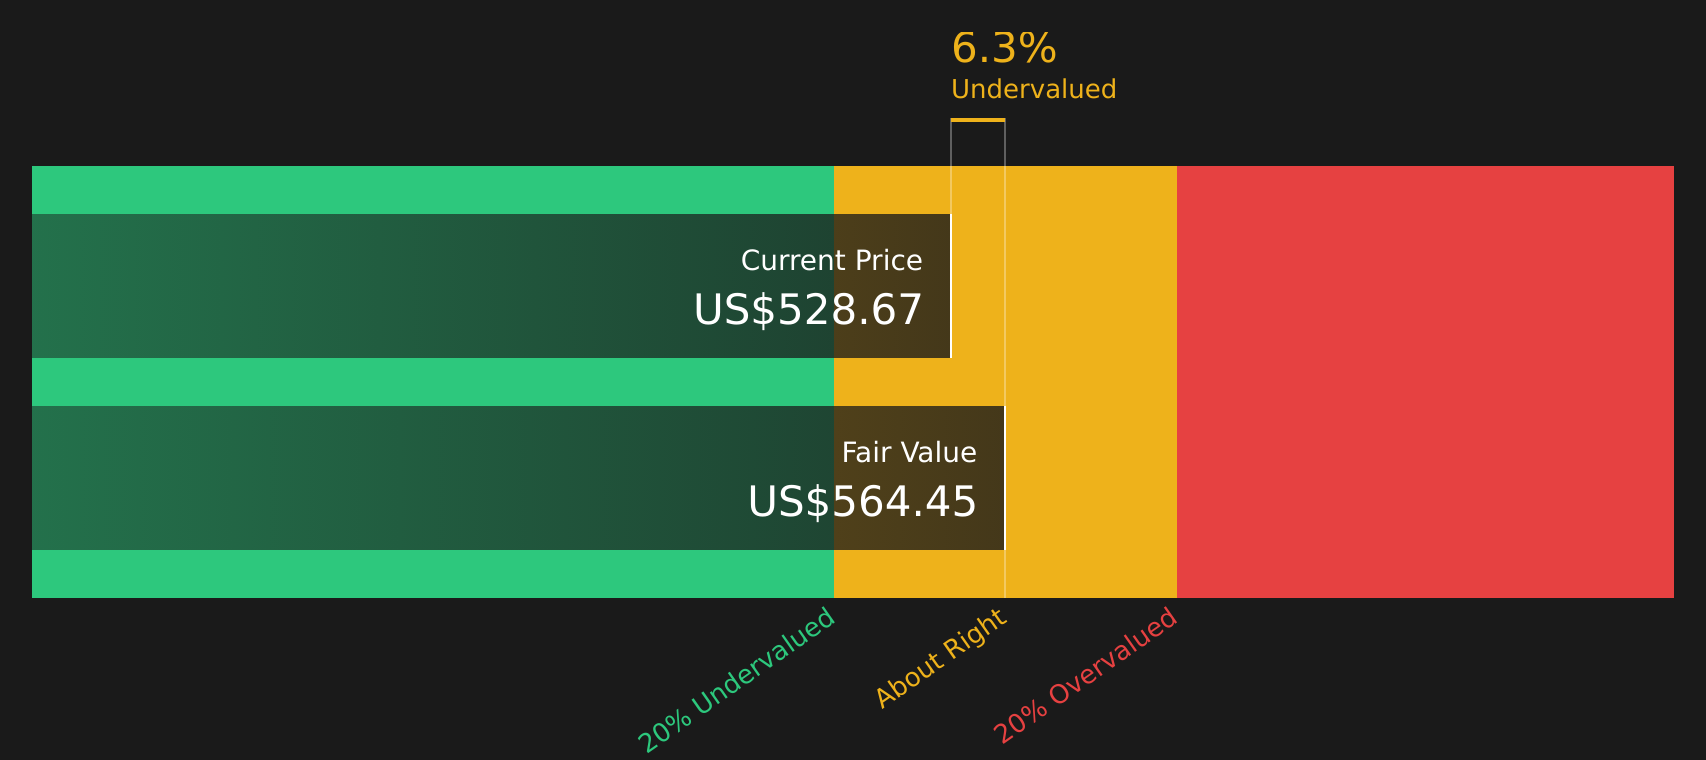
Simply Wall St performs a discounted cash flow (DCF) on every stock in the world every day (check out Northrop Grumman for example). We show the entire calculation in full. You can track the result in your watchlist or portfolio and be alerted when this changes, or use our stock screener to discover 46 high quality undervalued stocks. If you save a screener we even alert you when new companies match - so you never miss a potential opportunity.
Next Steps
Unsure how to weigh Northrop Grumman's mix of concerns and bright spots? Take a closer look at the full picture and shape your own view with the 4 key rewards and 1 important warning sign
Looking for more investment ideas beyond Northrop Grumman?
If Northrop Grumman has sharpened your focus on quality defense exposure, do not stop here. Broader market tools can help you spot other compelling opportunities.
- Target potential mispricings by scanning companies that combine strong fundamentals with attractive valuations using the 46 high quality undervalued stocks.
- Prioritise resilience first and hunt for companies with sturdy financial footing through the solid balance sheet and fundamentals stocks screener (47 results).
- Get ahead of the crowd by searching for quality businesses that are still flying under most investors’ radar via the screener containing 20 high quality undiscovered gems.
This article by Simply Wall St is general in nature. We provide commentary based on historical data and analyst forecasts only using an unbiased methodology and our articles are not intended to be financial advice. It does not constitute a recommendation to buy or sell any stock, and does not take account of your objectives, or your financial situation. We aim to bring you long-term focused analysis driven by fundamental data. Note that our analysis may not factor in the latest price-sensitive company announcements or qualitative material. Simply Wall St has no position in any stocks mentioned.