OneMain Holdings NYSE OMF Earnings Rebound And 26.3% Margin Challenge Bearish Narratives
OneMain Holdings, Inc. OMF | 57.67 | +0.02% |
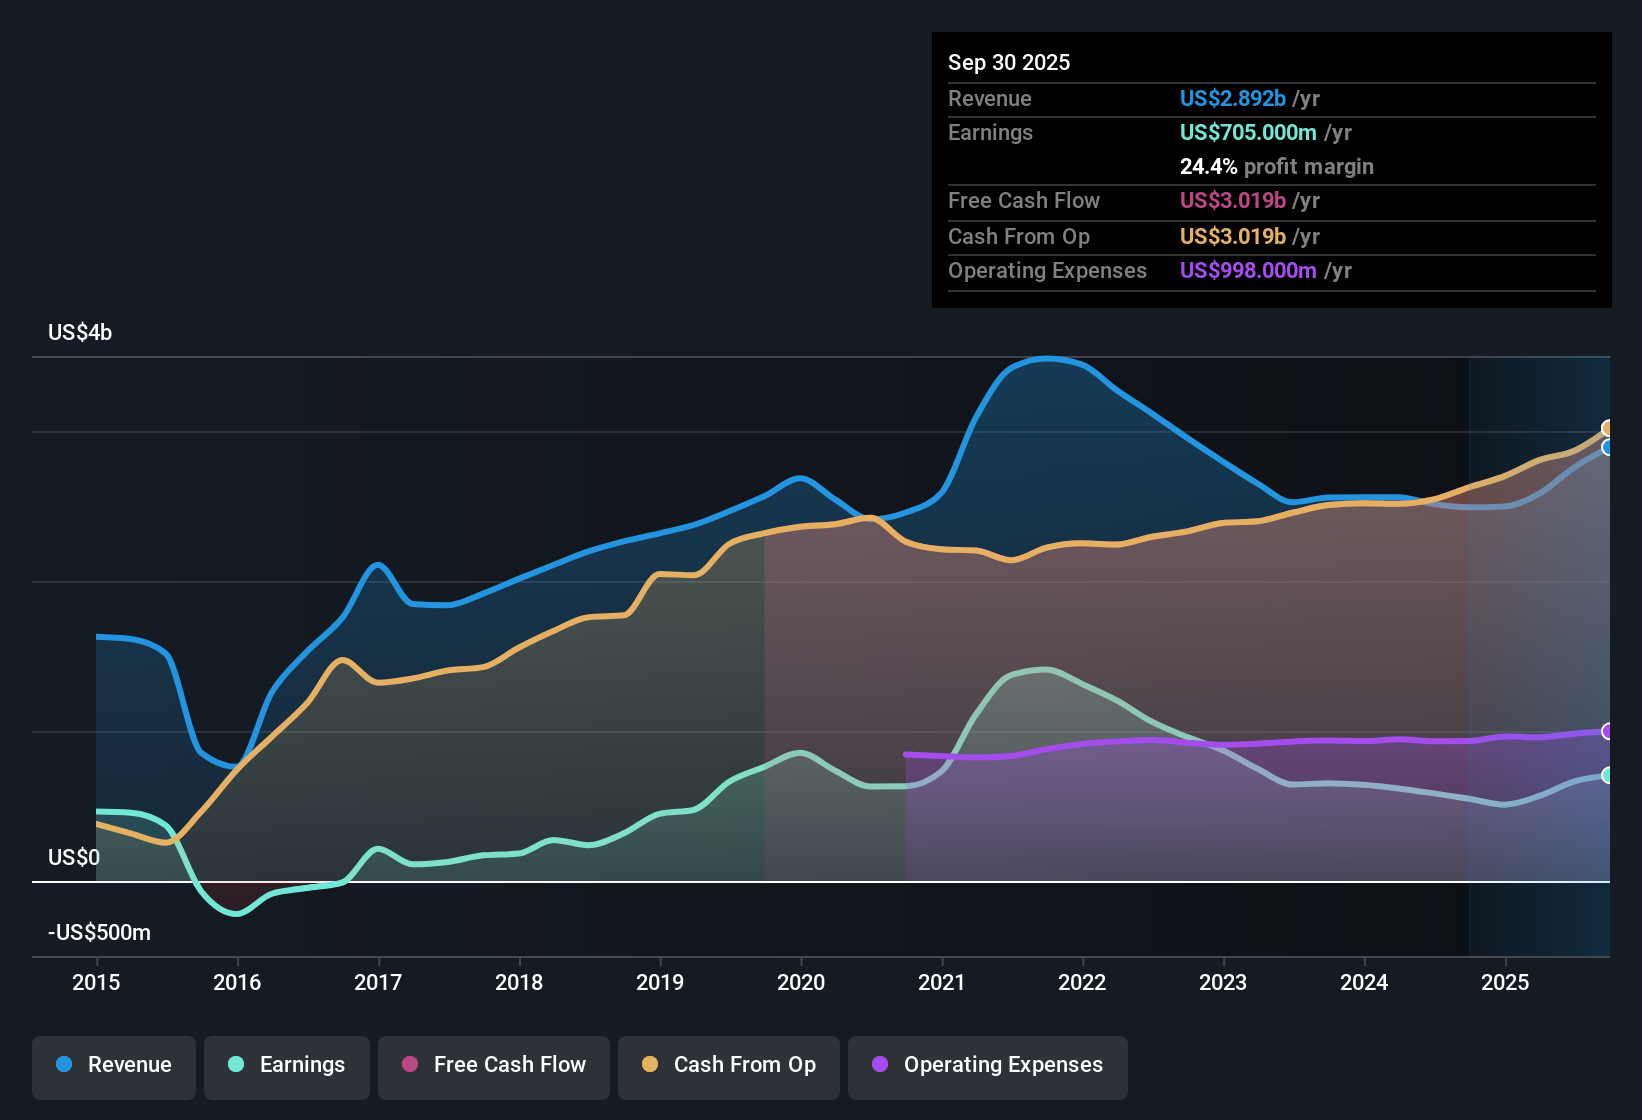
How OneMain Holdings Set the Tone With Its Latest FY 2025 Numbers
OneMain Holdings (OMF) closed out FY 2025 with Q4 revenue of US$745 million and basic EPS of US$1.72, providing a clear snapshot of where the business stands after a busy year of lending activity and credit performance. The company reported an increase in revenue from US$665 million in Q4 2024 to US$745 million in Q4 2025, while basic EPS moved from US$1.05 to US$1.72 over the same period. On a trailing 12-month basis, EPS came in at US$6.56 on revenue of about US$3.0 billion. For investors, the combination of higher net income and a trailing net margin in the mid 20s places emphasis on how sustainable these margins appear when viewed alongside credit costs and funding conditions.
See our full analysis for OneMain Holdings.With the headline numbers on the table, the next step is to see how this earnings profile aligns with the dominant market narratives around OneMain, where expectations on growth, risk and consistency sometimes move in different directions.
26.3% Net Margin Puts Profitability in Focus
- On a trailing 12‑month basis, OneMain converted US$2.973b of revenue into US$783 million of net income, implying a 26.3% net margin compared with 20.4% a year earlier.
- For investors taking a more bullish view, this higher 26.3% margin sits alongside trailing EPS of US$6.56, so those who argue the business can support stronger profitability now have both a wider margin and higher earnings per share to point to, even though longer term 5‑year earnings trends show an average 16.2% decline per year.
53.8% Earnings Pickup Versus 5‑Year Decline
- Reported earnings rose 53.8% over the last year after a period where earnings fell on average 16.2% per year over five years, with trailing net income at US$783 million and trailing revenue at US$2.973b.
- Critics who lean bearish often focus on that 5‑year earnings decline, and this history still matters, yet the recent 53.8% one‑year earnings increase and trailing EPS of US$6.56 show that recent performance looks very different from the longer term pattern, which makes this year a kind of stress test for whether the rebound can persist.
P/E Of 9.3x Versus 19.3x US Market
- At a P/E of 9.3x compared with the US market on 19.3x and peers at 16.2x, the shares trade at a lower multiple than the broader market and peer group, even though they are a little higher than the US consumer finance industry average P/E of 8.2x.
- One factor that challenges a purely bullish valuation story is that this lower P/E sits alongside flagged balance sheet risks, with debt coverage by operating cash flow described as weak and the dividend record called unstable, so investors weighing the 9.3x multiple against those funding and payout risks will likely see the current pricing as a trade off between headline value and financial resilience.
Some investors will see that P/E gap versus the wider US market as an opportunity, others will focus on the debt and dividend flags, so it can help to walk through both sides of the argument in more detail before making up your mind. Curious how numbers become stories that shape markets? Explore Community Narratives
Next Steps
Don't just look at this quarter; the real story is in the long-term trend. We've done an in-depth analysis on OneMain Holdings's growth and its valuation to see if today's price is a bargain. Add the company to your watchlist or portfolio now so you don't miss the next big move.
See What Else Is Out There
Despite the recent 53.8% earnings pickup, OneMain still carries a 5 year earnings decline, balance sheet concerns and an unstable dividend profile.
If those debt and payout flags make you cautious, it is worth checking companies in our solid balance sheet and fundamentals stocks screener (45 results) that prioritize financial strength and consistency right now.
This article by Simply Wall St is general in nature. We provide commentary based on historical data and analyst forecasts only using an unbiased methodology and our articles are not intended to be financial advice. It does not constitute a recommendation to buy or sell any stock, and does not take account of your objectives, or your financial situation. We aim to bring you long-term focused analysis driven by fundamental data. Note that our analysis may not factor in the latest price-sensitive company announcements or qualitative material. Simply Wall St has no position in any stocks mentioned.