Papa John's (PZZA) Stock After Multi‑Year Slide Is The Recent Rebound Enough
Papa John's International, Inc. PZZA | 0.00 |
- If you are wondering whether Papa John's International stock at around US$33 is a bargain or a value trap, the starting point is understanding what the current price actually reflects.
- The share price is up 4.8% over the last week, yet remains down 4.5% over the last month, 17.7% year to date, and 30.2% over the past year. There have also been longer term declines of 49.8% over three years and 63.3% over five years that may influence how investors see its risk and recovery potential.
- Recent coverage of Papa John's International has focused on how the business is positioned in the competitive pizza and quick service restaurant space, including attention on brand perception and operational execution. These factors often feed through into sentiment on the stock. Commentary has also highlighted how shifting consumer preferences and promotional activity across the sector can influence expectations for the company, giving context to the share price moves you see today.
- On Simply Wall St's framework, Papa John's International currently has a value score of 1 out of 6. The rest of this article will walk through what different valuation methods say about that price and then finish with a broader way to think about valuation that goes beyond any single metric.
Papa John's International scores just 1/6 on our valuation checks. See what other red flags we found in the full valuation breakdown.
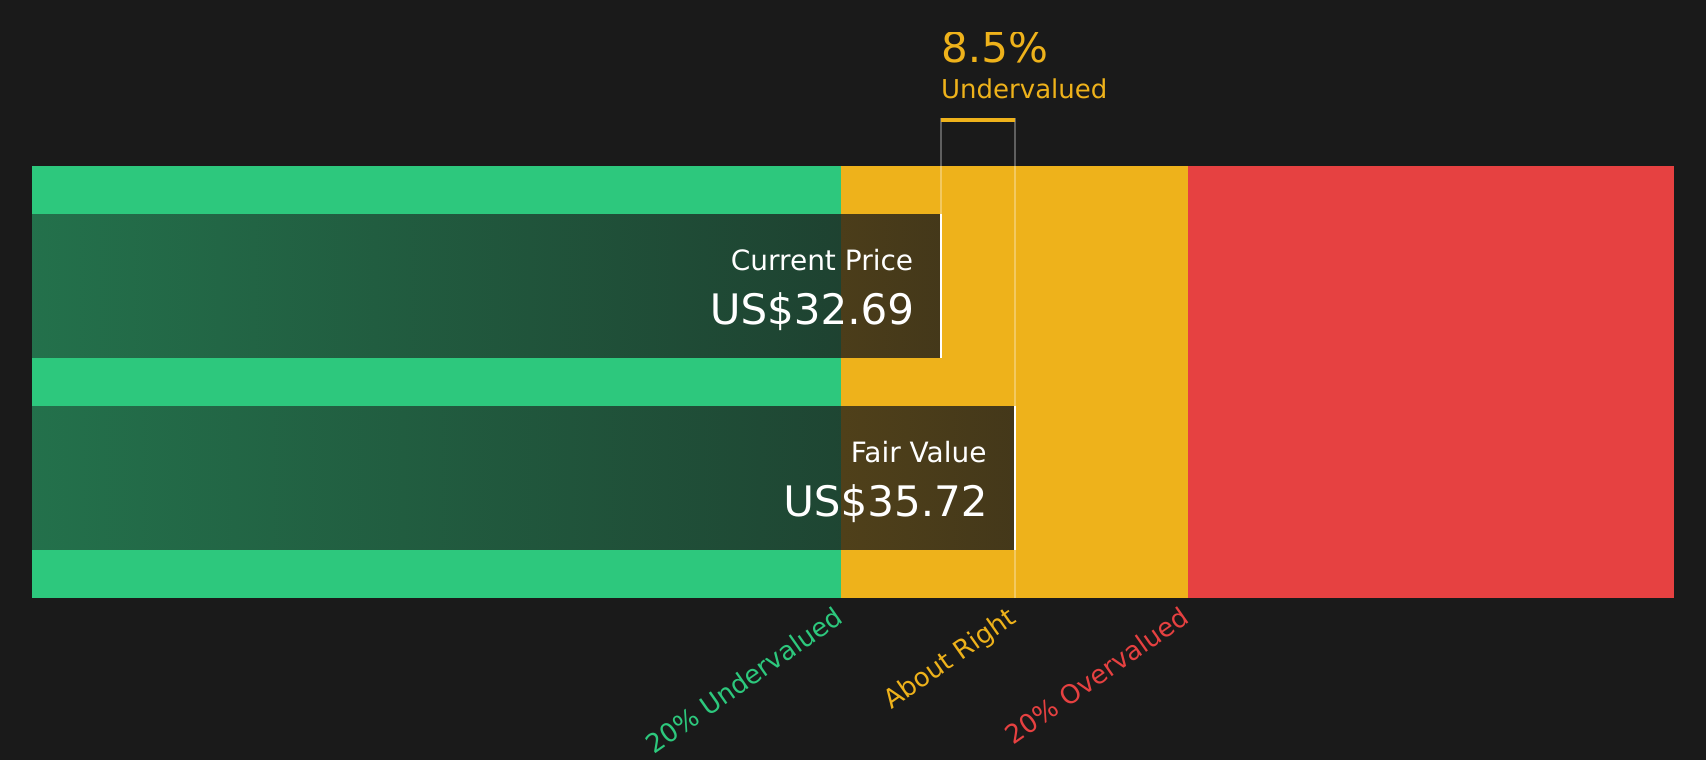
Approach 1: Papa John's International Discounted Cash Flow (DCF) Analysis
A Discounted Cash Flow model looks at the cash Papa John's International is expected to generate in the future, then discounts those projected cash flows back to today to estimate what the stock might be worth right now.
For Papa John's International, the model uses last twelve months Free Cash Flow of about $30.8 million and a 2 Stage Free Cash Flow to Equity approach. Analysts provide detailed cash flow estimates out to 2027, including projected Free Cash Flow of $90.84 million in 2027. Simply Wall St then extrapolates cash flows further out, with ten year projections that gradually change each year rather than assuming a single growth rate.
Discounting these cash flows back to today produces an estimated intrinsic value of about $35.89 per share. Compared with the current share price of around $33, the DCF output suggests the stock trades at roughly a 7.6% discount. This is a fairly small gap and leaves limited margin of error in the assumptions.
Result: ABOUT RIGHT
Papa John's International is fairly valued according to our Discounted Cash Flow (DCF), but this can change at a moment's notice. Track the value in your watchlist or portfolio and be alerted on when to act.
Approach 2: Papa John's International Price vs Earnings
For a profitable company like Papa John's International, the P/E ratio is a useful way to relate what you pay for the stock to the earnings it currently generates. Investors typically look for a P/E that lines up with their expectations for the company’s growth and the risk they are taking on, with higher growth or lower perceived risk often supporting a higher P/E multiple.
Papa John's International trades on a P/E of 39.67x, compared with the Hospitality industry average of 22.20x and a peer average of 33.28x. That already indicates the stock is priced above broad industry and peer benchmarks. However, simple comparisons can miss important context such as growth outlook, profitability, company size and specific risk factors.
Simply Wall St’s Fair Ratio for Papa John's International is 33.51x. This is a proprietary estimate of what the P/E might reasonably be, given factors like the company’s earnings growth profile, industry, profit margins, market cap and risk characteristics. Because it adjusts for these drivers, the Fair Ratio can offer a more tailored reference point than raw peer or industry averages. With the current P/E at 39.67x versus a Fair Ratio of 33.51x, the stock screens as overvalued on this measure.
Result: OVERVALUED

P/E ratios tell one story, but what if the real opportunity lies elsewhere? Start investing in legacies, not executives. Discover our 20 top founder-led companies.
Upgrade Your Decision Making: Choose your Papa John's International Narrative
Earlier it was mentioned that there is an even better way to understand valuation, so Narratives are introduced here as a simple way for you to attach your view of Papa John's International, such as expectations for future revenue, earnings, margins and a fair value, to a clear story that connects those assumptions to what you think is happening with the business.
On Simply Wall St, Narratives sit inside the Community page and turn that story into a full forecast and fair value estimate, then line it up against the current share price so you can quickly see whether your Narrative suggests Papa John's International stock looks cheap, expensive, or roughly in line with your view.
Because Narratives refresh when new information arrives, such as earnings, takeover headlines or product announcements, your fair value automatically adapts so you are not working from stale assumptions.
For Papa John's International today, one investor might align with a more optimistic Narrative that points to a Fair Value around US$49.71 based on margin improvement and digital progress. Another might prefer a more cautious Narrative closer to US$32.00 that focuses on traffic, cost pressure and store closures. That spread shows how the same stock can look very different once you spell out the story behind your numbers.
For Papa John's International however, we will make it really easy for you with previews of two leading Papa John's International Narratives:
Fair value: about US$37.44 per share
Gap to that fair value from the last close of US$33.16: roughly 11.4% below the narrative fair value
Revenue trend assumption: revenue is expected to decline about 2.79% a year
- Analysts building this case see refranchising, supply chain savings and overseas expansion as key supports for a gradual margin rebuild over time.
- The narrative assumes earnings reach about US$91.4m by 2029 with profit margins rising from 1.4% to around 4.9%, supported by product development and heavier marketing spend.
- To reach the outlined fair value, Papa John's International would need to trade on a future P/E of roughly 18.4x. This is below the current P/E cited for the wider US Hospitality group in this narrative set.
Fair value: about US$32.00 per share
Gap to that fair value from the last close of US$33.16: roughly 3.6% above the narrative fair value
Revenue trend assumption: revenue is expected to decline about 2.47% a year
- This more cautious narrative leans on analyst targets closer to US$32.00, with store closures, cost pressure and changing consumer preferences all weighing on long run revenue and profitability expectations.
- Even in this case, the assumptions still include some margin improvement to around 4.1% and earnings of about US$77.6m by 2029, but with less confidence in how durable that improvement might be.
- The scenario also works off a future P/E of about 18.4x and highlights that if traffic, development and brand strength lag, current pricing could sit above what the bearish cohort considers comfortable.
If you want to keep building your own view on Papa John's International, the easiest next step is to read these Narratives in full, compare which assumptions feel closer to your expectations, and then track how your chosen story holds up as new data arrives through See what the community is saying about Papa John's International.
Do you think there's more to the story for Papa John's International? Head over to our Community to see what others are saying!

This article by Simply Wall St is general in nature. We provide commentary based on historical data and analyst forecasts only using an unbiased methodology and our articles are not intended to be financial advice. It does not constitute a recommendation to buy or sell any stock, and does not take account of your objectives, or your financial situation. We aim to bring you long-term focused analysis driven by fundamental data. Note that our analysis may not factor in the latest price-sensitive company announcements or qualitative material. Simply Wall St has no position in any stocks mentioned.