Philip Morris International (PM) Margin Surge Reinforces Bullish Narratives Despite Premium P/E
Philip Morris International Inc. PM | 159.47 159.47 | -2.02% 0.00% Pre |
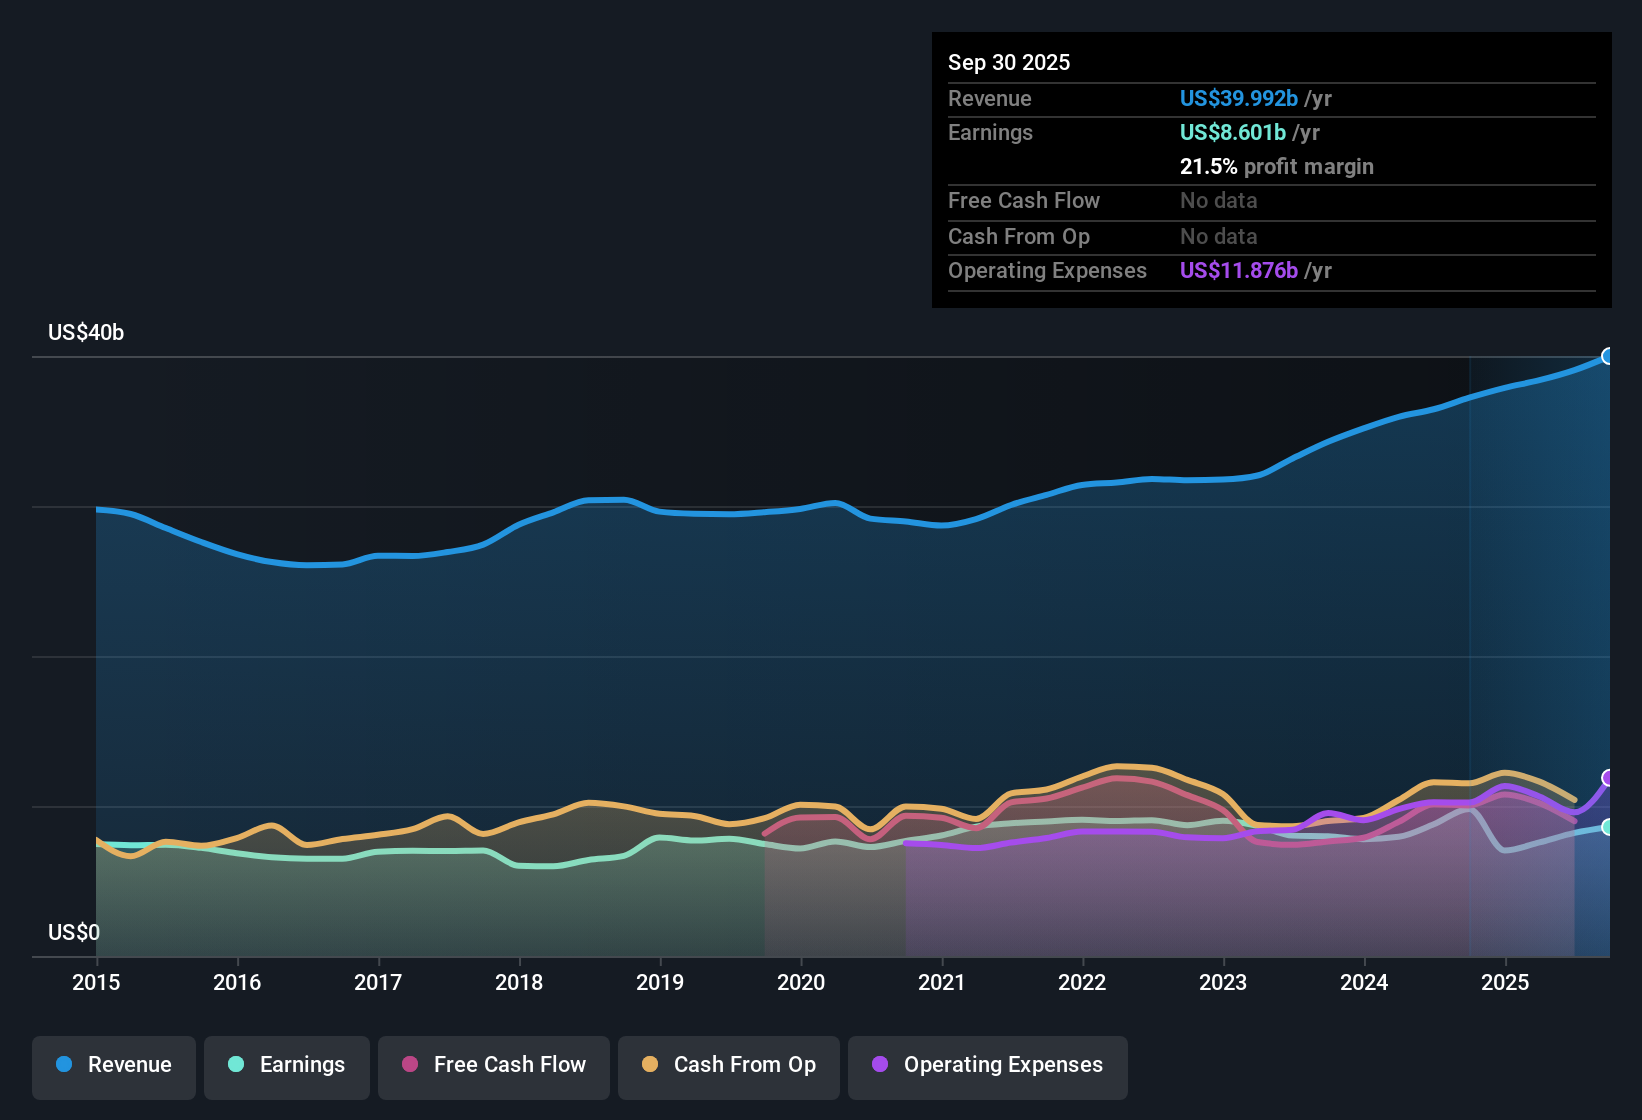
Philip Morris International (PM) has put up a busy FY 2025, with Q4 revenue of US$10.4b, basic EPS of US$1.39 and net income of US$2.2b, alongside trailing 12 month figures of US$40.6b in revenue, EPS of US$7.27 and net income of US$11.3b. The company has seen quarterly revenue move from US$9.7b in Q4 2024 to US$10.4b in Q4 2025, while EPS shifted from a loss of US$0.37 to EPS of US$1.39, setting up a year framed by higher margins and firmer profitability metrics that investors will be weighing against the growth profile.
See our full analysis for Philip Morris International.With the headline numbers on the table, the next step is to see how this earnings story lines up with the most common narratives around Philip Morris International and where the fresh figures start to challenge those views.
27.9% net margin reshapes the profit story
- Over the last 12 months, net profit margin was 27.9% on US$40.6b of revenue and US$11.3b of net income, compared with 18.6% a year earlier. A much bigger slice of each sales dollar is currently falling to the bottom line.
- What stands out for the bullish camp is how this higher margin profile lines up with their focus on strong cash generation, with:
- Trailing earnings up 61.3% year over year alongside that margin move, which heavily supports the bullish view that the business is currently converting sales into profit at a higher rate.
- Full year 2025 net income across the four quarters totaling about US$11.3b, which fits the bullish argument that the core business is still producing large absolute profits even as the product mix shifts.
61.3% earnings growth versus 0.2% five year trend
- Trailing 12 month earnings growth of 61.3% sits against a five year annualized earnings growth rate of about 0.2%. The latest year looks very strong compared with the longer run average in the data.
- Bears who question how repeatable this is get some backing from the numbers, because:
- Earnings in FY 2025 stepped down from US$3.5b in Q3 to US$2.2b in Q4 even as full year growth remains high, which gives cautious investors something to point to when they argue that year to year strength can include chunky swings between quarters.
- Forecast earnings growth of about 8.3% per year in the dataset is far below the recent 61.3% jump, which critics highlight as a sign that the latest surge should not automatically be treated as a new long term pace.
P/E of 25.1x and DCF fair value gap
- The shares trade on a P/E of 25.1x compared with 14.4x for the Global Tobacco industry and 27.9x for peers. The DCF fair value of US$226.50 sits above the current price of US$182.81 and above the US$181.31 analyst target given in the data.
- Supporters of the bullish view point to valuation tension here, because:
- The P/E premium to the broader industry sits alongside a DCF fair value that is about 19.3% above the share price, which strongly supports the bullish claim that current pricing does not fully reflect recent profit strength in this model.
- At the same time, the dividend yield of 3.22% is flagged as not well covered by earnings and the company has a high level of debt, which bears use to argue that leverage and cash returns still matter even when one valuation model points higher.
Some investors will want to see how this mix of premium P/E, high margins and debt fits into a fuller story before making any calls, so it can help to read the broader narrative that ties these numbers together. 📊 Read the full Philip Morris International Consensus Narrative.
Next Steps
Don't just look at this quarter; the real story is in the long-term trend. We've done an in-depth analysis on Philip Morris International's growth and its valuation to see if today's price is a bargain. Add the company to your watchlist or portfolio now so you don't miss the next big move.
See What Else Is Out There
For all the strong margins and earnings, questions around dividend coverage and a high level of debt leave some investors uneasy about the balance sheet.
If you want alternatives that prioritize sturdier finances and income support, check out our solid balance sheet and fundamentals stocks screener (45 results) to quickly zero in on companies built to handle stress.
This article by Simply Wall St is general in nature. We provide commentary based on historical data and analyst forecasts only using an unbiased methodology and our articles are not intended to be financial advice. It does not constitute a recommendation to buy or sell any stock, and does not take account of your objectives, or your financial situation. We aim to bring you long-term focused analysis driven by fundamental data. Note that our analysis may not factor in the latest price-sensitive company announcements or qualitative material. Simply Wall St has no position in any stocks mentioned.