Pool (POOL) Stock After 31% One-Year Slide Are DCF Signals Being Ignored
Pool Corporation POOL | 0.00 |
- Investors may be wondering whether Pool at around US$195 still reflects its underlying worth, or if recent pricing has moved it closer to a bargain or a value trap.
- The stock has risen 5.1% over the past week and 11.2% over the past month, yet remains down 15.1% year to date and has declined 31.0% over the past year. This performance may leave you questioning whether sentiment or fundamentals are doing the heavy lifting.
- Recent news coverage has focused on Pool as a key player in pool supplies and equipment, often highlighting how the company fits into broader themes in home improvement and discretionary spending. This context helps frame the recent share price moves as investors reassess how the business is positioned in its sector.
- On Simply Wall St's valuation checks, Pool scores 3 out of 6 for value, as shown by its current valuation score. The discussion ahead will compare different valuation methods and then finish with a more complete way to think about what this stock might really be worth.
Approach 1: Pool Discounted Cash Flow (DCF) Analysis
A Discounted Cash Flow, or DCF, model projects a company’s future cash flows and then discounts them back to today’s dollars, aiming to estimate what the business could be worth right now.
For Pool, the model used is a 2 Stage Free Cash Flow to Equity approach. The latest twelve month Free Cash Flow is about $308.1 million. Analysts provide explicit forecasts out to 2028, with Simply Wall St extending those projections further. Within this framework, projected Free Cash Flow in 2035 is $564.1 million, with interim years ranging from $353.6 million in 2026 to $545.5 million in 2034, all in $ and based on a mix of analyst estimates and extrapolated figures.
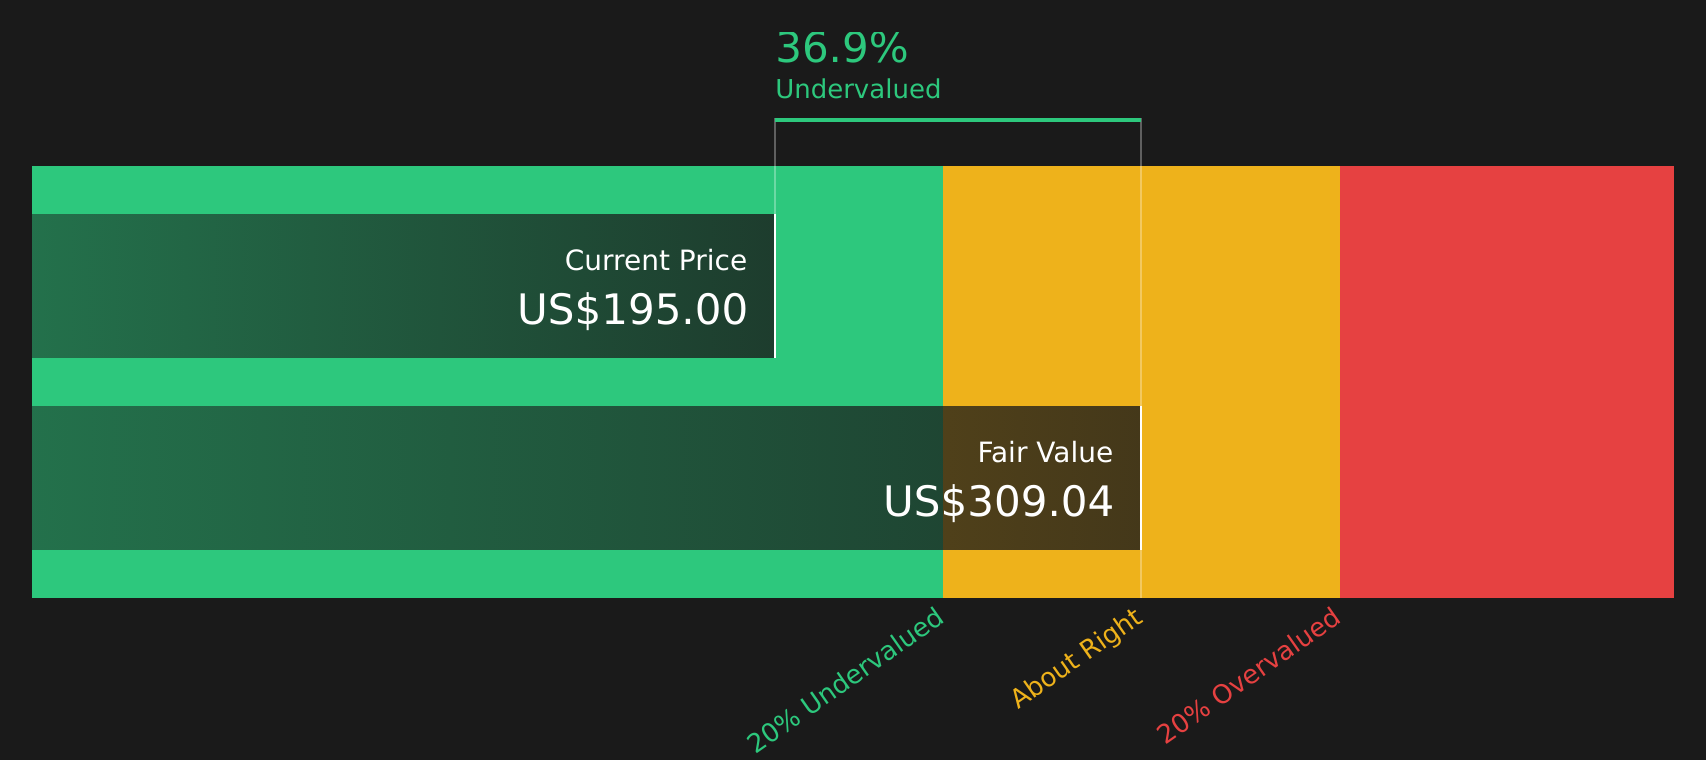
Pulling these cash flows together, the DCF model points to an estimated intrinsic value of about $309.33 per share. Versus a share price around $195, this implies the stock is roughly 37.0% below that DCF estimate, which indicates the market price is meaningfully lower than the modelled cash flow value in this analysis.
Result: UNDERVALUED (per this DCF model)
Our Discounted Cash Flow (DCF) analysis suggests Pool is undervalued by 37.0%. Track this in your watchlist or portfolio, or discover 44 more high quality undervalued stocks.
Approach 2: Pool Price vs Earnings
For a profitable company like Pool, the P/E ratio is a straightforward way to relate what you pay for the stock to the earnings it currently generates. It helps you gauge how many dollars investors are paying for each dollar of earnings.
What counts as a "normal" or "fair" P/E usually reflects how the market views a company’s growth opportunities and risks. Higher expected growth or lower perceived risk can justify a higher P/E, while lower growth or higher risk tends to point to a lower multiple.
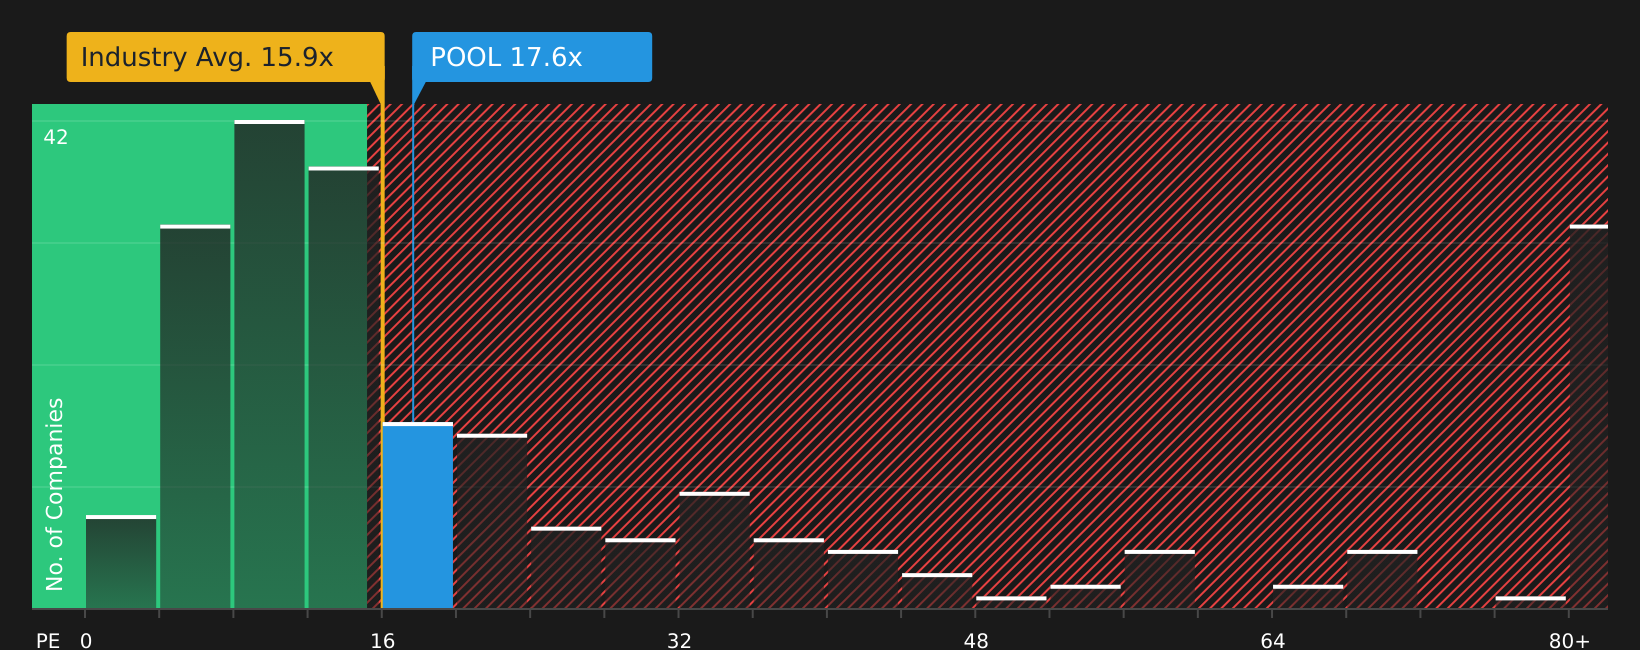
Pool currently trades on a P/E of 17.6x. That sits above the Retail Distributors industry average of about 15.3x and above the peer average of 13.0x. This suggests investors are paying a higher price for each dollar of Pool's earnings than for peers overall.
Simply Wall St’s proprietary Fair Ratio for Pool is 14.0x. This Fair Ratio aims to capture what P/E might be reasonable after factoring in elements such as earnings growth profile, profit margins, industry, market cap and company specific risks. Because it adjusts for these variables, it can give you a more tailored reference point than a simple comparison with peers or the broad industry.
Comparing the current 17.6x P/E to the 14.0x Fair Ratio indicates Pool trades above this fair value benchmark on an earnings multiple basis.
Result: OVERVALUED
Wall Street's queuing for one rocket. While SpaceX counts down to its IPO, other companies tied to the new space race are already in orbit. → 20 Compelling Space Companies watchlist · Global Space Race Investing Ideas screener · Scan the sector by valuation on Rocket Lab's valuation page.
Upgrade Your Decision Making: Choose your Pool Narrative
Earlier it was mentioned that there is an even better way to understand valuation. Meet Narratives, a simple tool on Simply Wall St’s Community page that lets you link your view of Pool’s story to specific forecasts for revenue, earnings and margins. You can then compare the Fair Value that drops out of that story with today’s share price to help decide whether to buy, hold or sell. Those Fair Values update automatically as new earnings or news arrive. Different investors often land in very different places, such as one bullish Pool Narrative pointing to a Fair Value around US$334, another cautious Narrative closer to US$229 and the wider analyst consensus in the middle near US$255.91, all based on their own assumptions about how the business will perform.
Do you think there's more to the story for Pool? Head over to our Community to see what others are saying!

This article by Simply Wall St is general in nature. We provide commentary based on historical data and analyst forecasts only using an unbiased methodology and our articles are not intended to be financial advice. It does not constitute a recommendation to buy or sell any stock, and does not take account of your objectives, or your financial situation. We aim to bring you long-term focused analysis driven by fundamental data. Note that our analysis may not factor in the latest price-sensitive company announcements or qualitative material. Simply Wall St has no position in any stocks mentioned.