Precigen (PGEN) Stock Could Be 79% Undervalued After FDA Exclusivity Win
Precigen Inc PGEN | 0.00 |
Precigen (PGEN) is back in focus after the FDA granted orphan drug exclusivity to PAPZIMEOS for adult recurrent respiratory papillomatosis, limiting similar competing therapies for seven years and defining a clearer commercial runway.
The FDA decision comes after a period of strong momentum for Precigen, with the share price delivering a 46.95% 3 month share price return and a very large 1 year total shareholder return. However, the 5 year total shareholder return is still down 29.33%.
If this kind of regulatory catalyst interests you, it may be worth broadening your search using our screener for 40 healthcare AI stocks
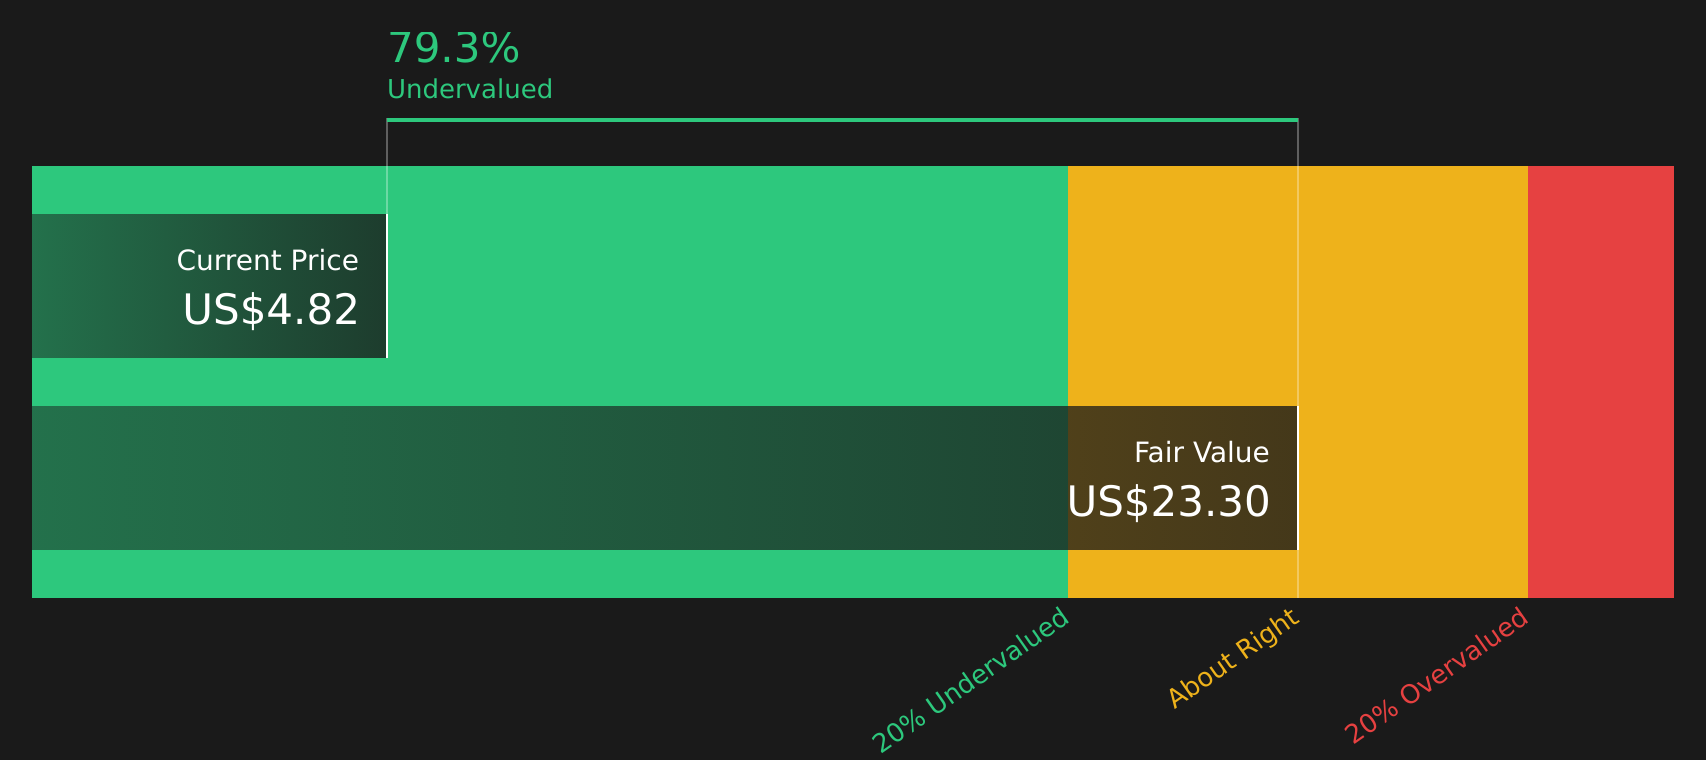
With Precigen trading at $4.82 and sitting at an estimated 79% discount to one valuation model and around 59% below the average analyst price target, investors now have to ask: is this a genuine opportunity, or is the market already pricing in the growth story?
Preferred Price-to-Book Multiple of 84.9x: Is It Justified for Precigen?
On the simple numbers, Precigen looks expensive, with a P/B ratio of 84.9x against an industry average of 2.5x and a peer average of 5.2x. That kind of gap suggests the market is attaching a very high value to the company relative to its current book value, despite its early stage earnings profile.
The P/B multiple compares a company’s market value to its net assets, which tends to matter more for asset-heavy or loss-making businesses where earnings do not yet tell the whole story. For Precigen, the key question is whether investors are paying up for its gene and cell therapy platforms and pipeline, rather than today’s balance sheet. With revenue at $31.6m and the company still reporting a loss of $383.4m, the current valuation appears to rest more on future potential than on present fundamentals.
Relative to the wider US Biotechs industry and to closer peers, Precigen’s 84.9x P/B multiple is far higher, which indicates expectations that differ meaningfully from the sector norm. If sentiment or assumptions around its platforms or trial programs shift, the P/B ratio is one metric that could move sharply as the market reassesses what level it is comfortable with over time.
Result: Price-to-book of 84.9x (OVERVALUED).
However, Precigen’s early stage losses and reliance on successful clinical outcomes mean any trial setbacks or funding challenges could quickly change how investors view that rich valuation.
Another View: What Does Precigen’s Cash Flow Signal?
While Precigen looks expensive on an 84.9x P/B, the SWS DCF model points the other way. With the stock at $4.82 against an estimated future cash flow value of $23.30, this approach suggests the shares may be undervalued. So which signal should matter more to you?
Simply Wall St performs a discounted cash flow (DCF) on every stock in the world every day (check out Precigen for example). We show the entire calculation in full. You can track the result in your watchlist or portfolio and be alerted when this changes, or use our stock screener to discover 45 high quality undervalued stocks. If you save a screener we even alert you when new companies match - so you never miss a potential opportunity.
Next Steps
With Precigen pulling in both concerns and optimism, this is a moment to review the data quickly and shape your own view using the 2 key rewards and 4 important warning signs.
Looking For More Ideas Beyond Precigen?
If Precigen has caught your attention, do not stop there. Broaden your watchlist now so you are not relying on a single story for inspiration.
- Target income potential by reviewing companies in the 8 dividend fortresses that might suit a yield focused approach.
- Hunt for quality at a discount by scanning the 45 high quality undervalued stocks that screens for strong businesses priced below estimated worth.
- Reduce portfolio stress by checking the 66 resilient stocks with low risk scores that highlights companies with more resilient profiles.
This article by Simply Wall St is general in nature. We provide commentary based on historical data and analyst forecasts only using an unbiased methodology and our articles are not intended to be financial advice. It does not constitute a recommendation to buy or sell any stock, and does not take account of your objectives, or your financial situation. We aim to bring you long-term focused analysis driven by fundamental data. Note that our analysis may not factor in the latest price-sensitive company announcements or qualitative material. Simply Wall St has no position in any stocks mentioned.