Procter & Gamble (PG) Stock Valuation Check After Recent Short-Term Gains
Procter & Gamble Company PG | 0.00 |
Recent performance snapshot
Procter & Gamble (PG) has been relatively steady, with the stock up about 0.9% over the past day and roughly 2.1% over the past week, while the past 3 months show a modest decline.
For context, PG’s 5.7% 1 month share price return and 5.5% year to date share price return contrast with a 1 year total shareholder return that is down 4.0%, suggesting near term momentum has picked up after a softer period.
If you are looking beyond consumer staples for other ideas, this could be a useful moment to scan the market and uncover 20 top founder-led companies
So with Procter & Gamble trading at $149.61, at an implied 19.9% discount to one intrinsic value estimate and a 9.2% gap to the average analyst target, is there still a buying opportunity here, or is the market already pricing in future growth?
Most Popular Narrative: 23.6% Overvalued
According to the most followed narrative from andre_santos, a fair value of $121.06 sits well below PG's last close at $149.61, so the market price and this valuation are some distance apart.
Procter & Gamble, despite being within a very competitive industry, still has some competitive advantages shown in its higher operating margin above the ~20% mark and the Morningstar Wide Moat rating. Also, the fact that the ROIC is double the Cost of Capital means its capital allocation is being well managed. Its solid Moody's Debt Rating along with the Low Uncertainty Morningstar rating presents the company as a stable and reliable investment if the opportunity arises.
Curious how a company with strong margins, high returns on capital and a wide moat can still screen as overvalued? The narrative leans heavily on detailed assumptions around future revenue growth, profitability and discount rates that are not obvious from headline metrics. The full breakdown shows how those moving parts come together to justify a fair value well below the current share price.
Result: Fair Value of $121.06 (OVERVALUED)
However, this view could be challenged if consumer demand weakens or if margins, such as the 22% profit margin cited, come under pressure from higher costs.
Wall Street's queuing for one rocket. While SpaceX counts down to its IPO, other companies tied to the new space race are already in orbit. → 20 Compelling Space Companies watchlist · Global Space Race Investing Ideas screener · Scan the sector by valuation on Rocket Lab's valuation page.
Another angle on valuation
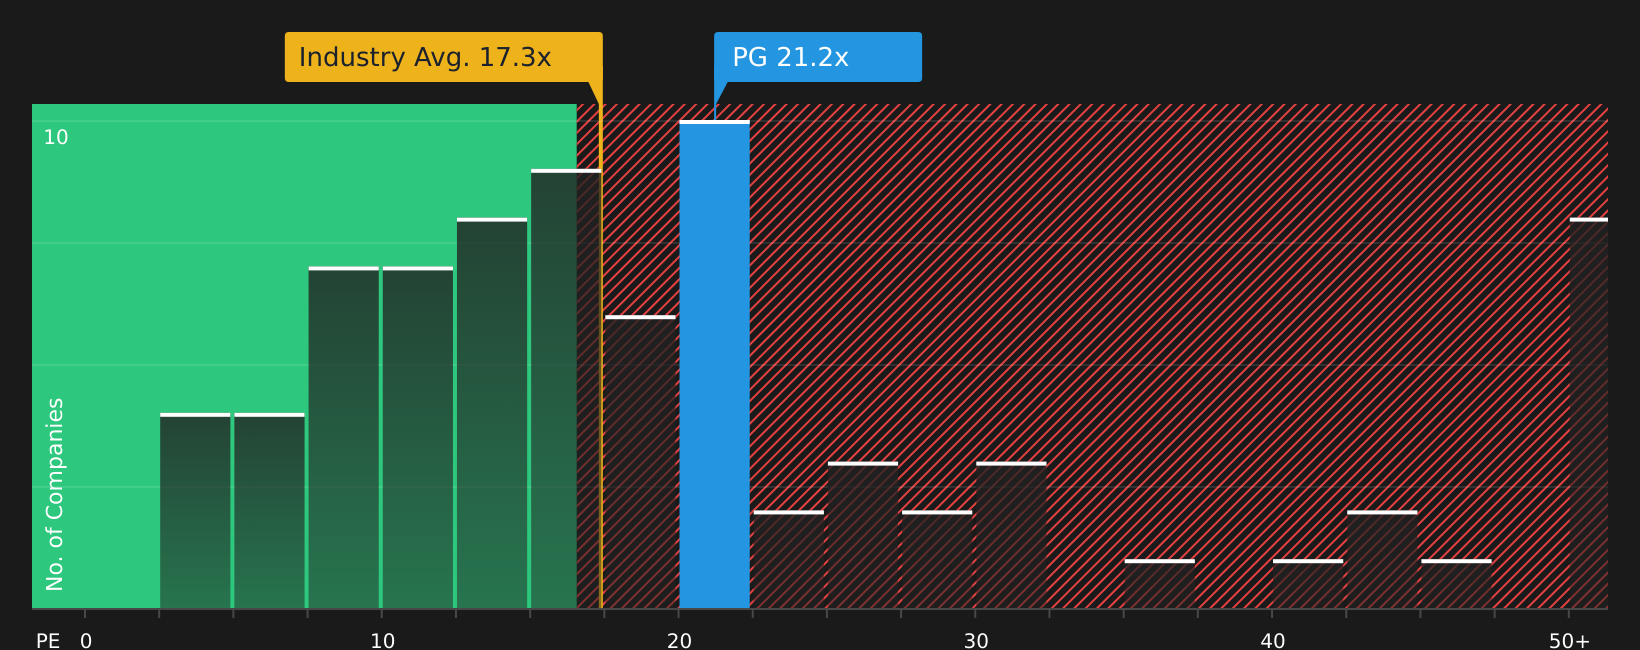
andre_santos’ narrative leans on detailed fair value work that points to PG being 23.6% above a $121.06 estimate. Our multiples check tells a different story. PG trades on a 21.3x P/E, which sits below peers at 25.3x and close to a fair ratio of 22.4x, which hints the market is not paying an extreme premium for its earnings. Could that smaller gap mean valuation risk is more balanced than the narrative suggests?
For a closer look at how these earnings multiples compare, including where the fair ratio sits relative to peers, See what the numbers say about this price — find out in our valuation breakdown.
Next Steps
The mix of concern and optimism around Procter & Gamble in this article shows how split sentiment can be. It makes sense to move quickly and pressure test the numbers yourself against the story you believe in by checking the 4 key rewards and 1 important warning sign
Looking for more investment ideas?
If PG feels fully priced, do not stop there. Put the same discipline to work on fresh opportunities that could better match your risk and return preferences.
- Spot potential bargains early by scanning companies that combine quality fundamentals with attractive pricing using the 44 high quality undervalued stocks.
- Build a more resilient income stream by reviewing stocks with over 5% yields in the 8 dividend fortresses.
- Prioritize sleep-at-night holdings by focusing on companies with stronger financial profiles through the solid balance sheet and fundamentals stocks screener (48 results).
This article by Simply Wall St is general in nature. We provide commentary based on historical data and analyst forecasts only using an unbiased methodology and our articles are not intended to be financial advice. It does not constitute a recommendation to buy or sell any stock, and does not take account of your objectives, or your financial situation. We aim to bring you long-term focused analysis driven by fundamental data. Note that our analysis may not factor in the latest price-sensitive company announcements or qualitative material. Simply Wall St has no position in any stocks mentioned.