Qualcomm Stock Hits Strategic Zone: Key Levels To Watch
QUALCOMM Incorporated QCOM | 0.00 |
Qualcomm (QCOM) is currently in the 9th Phase of its ongoing 18-Phase Adhishthana Cycle, and the structure suggests more upside could be in store, if the right levels hold. Here’s a breakdown of its unique multi-timeframe setup using the Adhishthana Principles.
Qualcomm Weekly Chart Breakdown

According to the Adhishthana Principles, our proprietary cyclical framework blending quantitative signals with behavioral archetypes; Qualcomm's weekly chart is showing signs of a setup for a Supreme Move.
Phase 9 typically marks the breakout from the consolidation pattern built during Phases 4 to 8. So far, Qualcomm has remained range-bound within this zone. However, it is respecting the lower end of the consolidation zone or the Cakra, signaling a breakout sometime in Phase 9, triggering a strong upside continuation.
Here's how the previous phases have aligned:
Phase 2 – The Rally of Buddhi:
Qualcomm traded sideways for 37 bars before launching a rally of ~110%, in line with Adhishthana expectations.
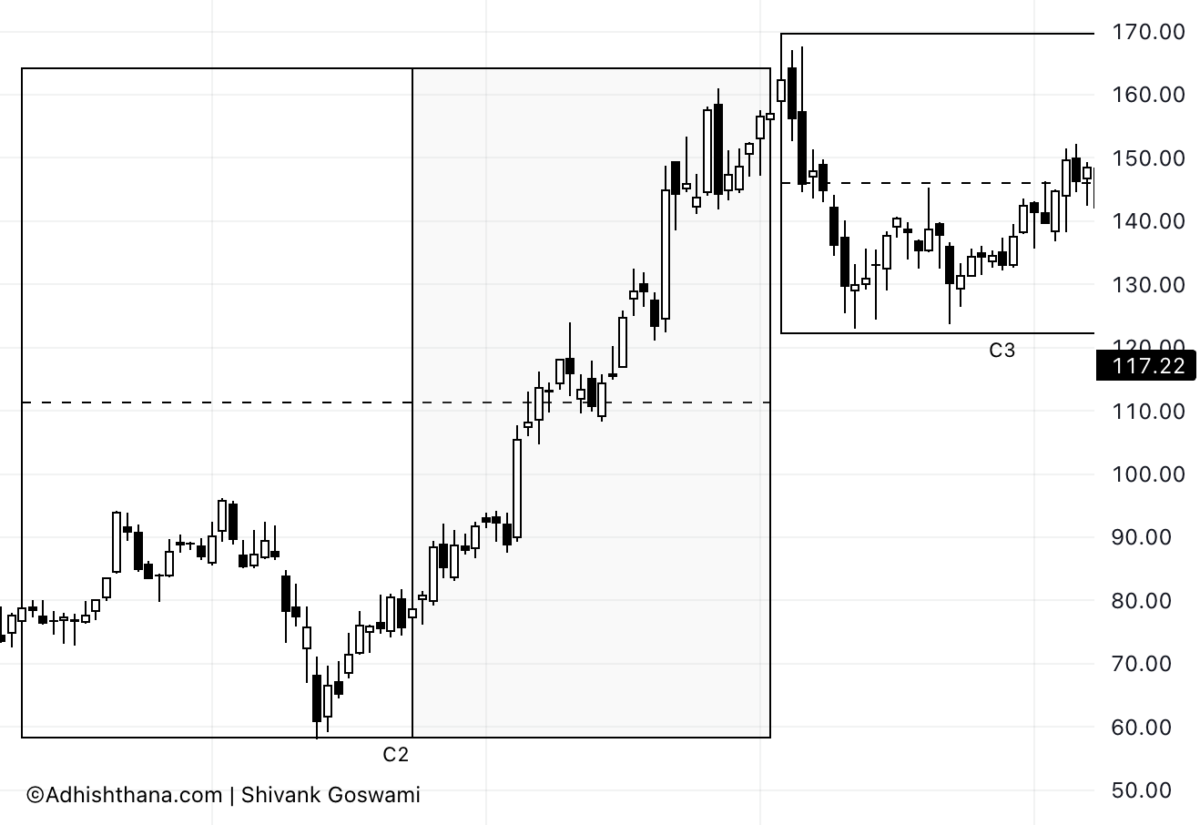
Phase 6 – Discovery of Nirvana:

The Nirvana Level was established at $117.22, this will act as a key valuation anchor for all subsequent corrections in this cycle.
Phase 7 – The Fall of Artha and Artharthi:
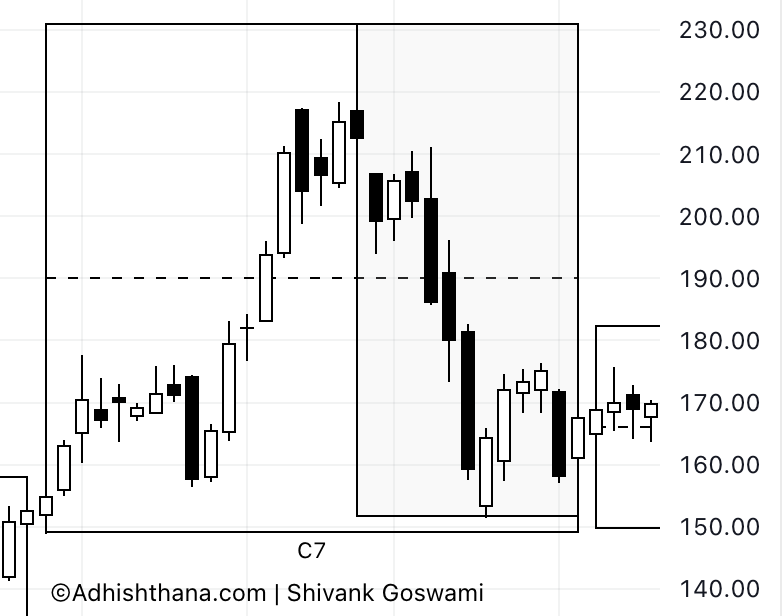
Qualcomm declined ~34% over exactly 7 red bars in line with the Adhishthana Principles, a classic pattern flushing out speculation and resetting valuations.
So far, the stock has maintained an 87.5% alignment with Adhishthana Principles on the weekly charts. If this trend continues, a breakout during Phase 9 could result in a meaningful move higher.
Qualcomm Monthly Chart Breakdown
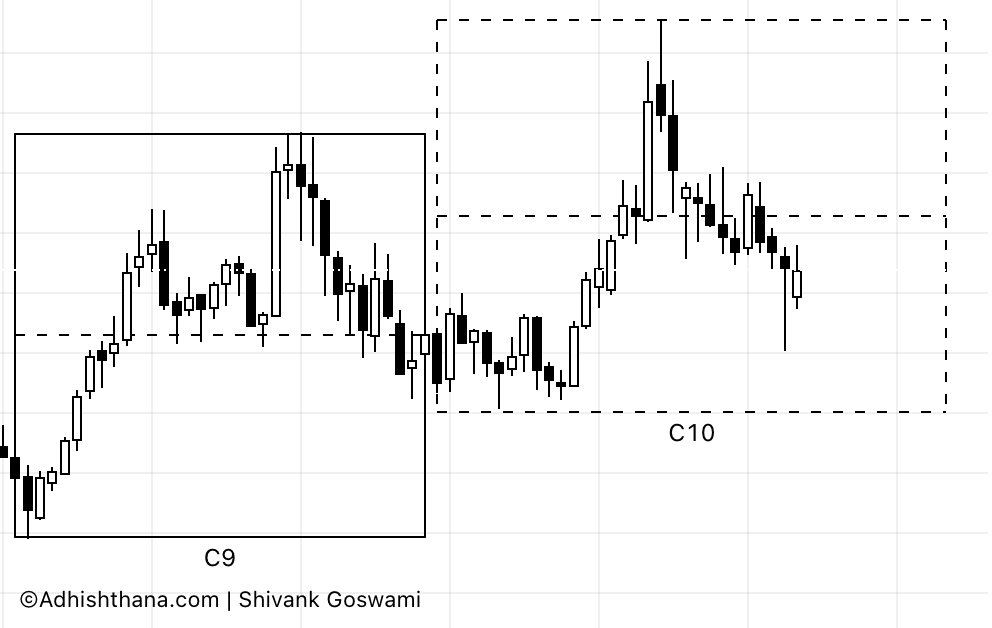
On the monthly timeframe, Qualcomm is currently in Phase 10, after completing a massive 237% breakout move in Phase 9—breaking out of a long-term consolidation between Phases 4 to 8.
According to the Adhishthana model, peaks in Phase 10 often form between the 18th and 23rd bars. Qualcomm topped out on the 19th bar at $230.63, followed by a ~35% correction. However, this peak will only be confirmed if the Phase 9 low of $58 is broken, which has not happened yet.
If Qualcomm continues to hold above the C9 midpoint and the Level of Nirvana as identified in the weekly charts, then $230.63 may not be the ultimate peak. Instead, a higher high could materialize in Phase 11.
Key Support Levels to Watch
- $117.22 – Weekly Nirvana Level
- $101.47 – Current low of Phase 10 (Monthly)
These levels are critical markers of value. If Qualcomm holds these zones, the case strengthens for a bullish Himalayan Formation Ascent during Phase 10 on the weekly charts, potentially aligning with further upside in the monthly timeframe.
Final Take
Qualcomm's multi-timeframe structure suggests a potential bullish convergence in the coming phases. If key support levels hold, and a breakout from the current range confirms on the weekly chart, a larger Supreme Move could be ahead. Patient investors should watch $117.22 and $101.47 as potential value accumulation zones.