Rambus (RMBS) Valuation After Record 2025 Results And Volatile Reaction To Softer Q1 2026 Outlook
Rambus Inc. RMBS | 0.00 |
Rambus (RMBS) has just delivered record Q4 and full year 2025 results, while at the same time flagging softer Q1 2026 guidance tied to a one off supply chain disruption. This mix has stirred sharp share volatility.
The market reaction has been sharp, with a 19.33% 7 day share price decline and a 2.72% 1 day drop resetting expectations after record 2025 results. This comes even as the 1 year total shareholder return of 45.81% and 5 year total shareholder return of 365.59% point to strong longer term momentum.
If you are watching how AI related chip names respond to earnings shocks, it could be a good moment to scan 33 AI infrastructure stocks as a broader set of possibilities beyond Rambus.
With Rambus posting record 2025 revenue and earnings yet trading about 20% below the average analyst target, the key question for investors is simple: is this pullback a chance to buy, or is future growth already priced in?
Most Popular Narrative: 18.3% Undervalued
Rambus last closed at $98.10, while the most followed narrative pegs fair value at $120, using a detailed cash flow and earnings profile to explain that gap.
The upcoming industry transition to MRDIMM technology, slated for full-scale adoption beginning in the second half of 2026, will significantly increase the silicon content per module. Rambus is well-positioned to benefit from this shift, which could materially expand its addressable market and drive multi-year revenue growth.
To see what kind of revenue ramp and margin profile is reflected in that $120 figure, and how sensitive it is to future AI demand curves, the full narrative lays out the exact growth path and valuation multiple that would need to hold for this pricing gap to close.
Result: Fair Value of $120 (UNDERVALUED)
However, there are still clear risks here, including slower uptake of new companion chips and delays to MRDIMM or next generation interface rollouts that could unsettle the current thesis.
Another View: Multiples Point To A Richer Price
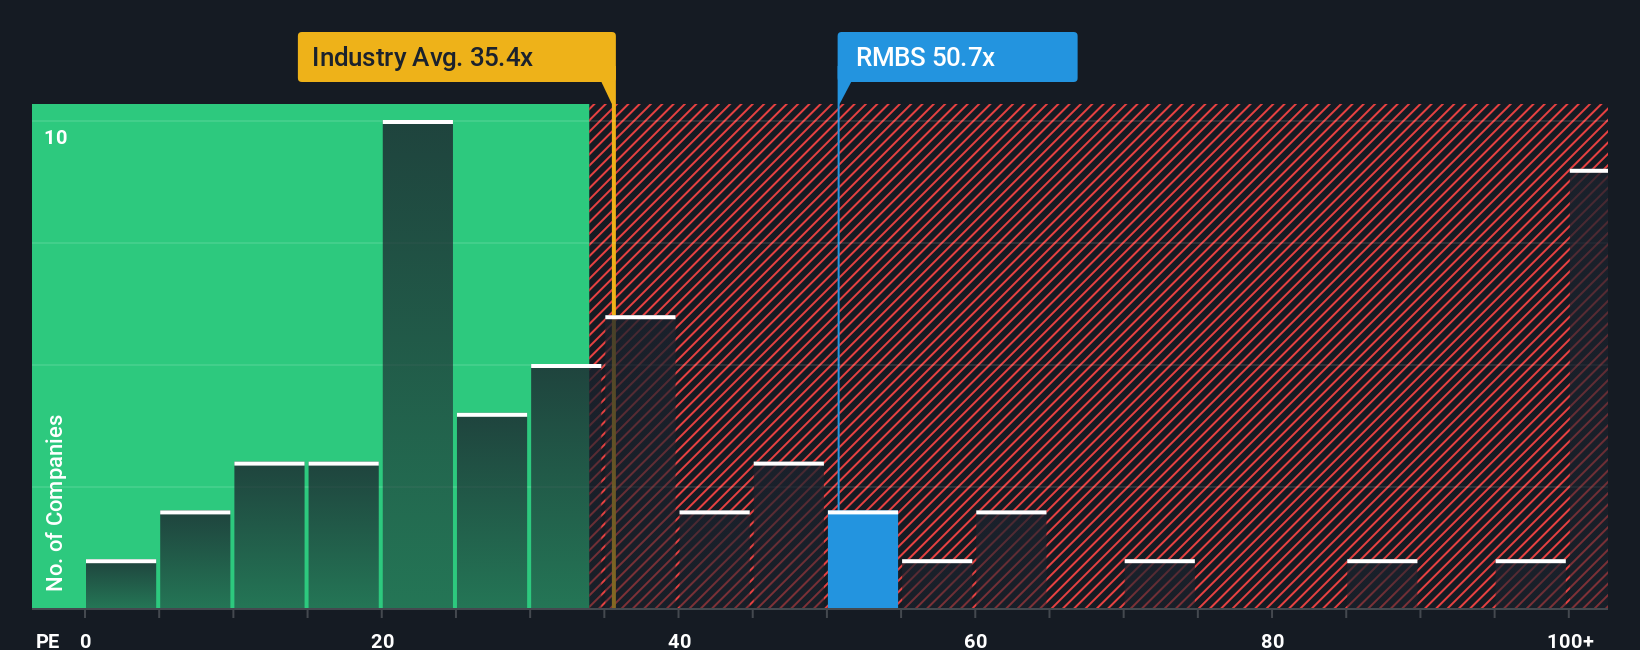
While the most followed narrative sees Rambus as 18.3% undervalued against a $120 fair value, current pricing tells a different story. At a P/E of 45.8x versus a fair ratio of 41.6x, the US Semiconductor industry at 40.4x and peers at 34.4x, Rambus looks expensive. For you, that premium raises a simple question: is it a cushion of quality, or extra downside risk if sentiment cools?
Build Your Own Rambus Narrative
If you are not fully aligned with these views or prefer to weigh the numbers yourself, you can piece together your own Rambus story in minutes, Do it your way.
A great starting point for your Rambus research is our analysis highlighting 3 key rewards and 1 important warning sign that could impact your investment decision.
Looking for more investment ideas?
If Rambus has your attention, do not stop your research here. The screener can quickly surface other opportunities that might suit your goals just as well.
- Target resilient compounding potential by scanning companies in our 81 resilient stocks with low risk scores. See which names keep risk scores in check while still offering upside potential.
- Hunt for mispriced opportunities by reviewing the 55 high quality undervalued stocks. Spot businesses where fundamentals and price may be out of sync.
- Strengthen your watchlist with quality by browsing the solid balance sheet and fundamentals stocks screener (46 results). Focus on companies built on sturdier financial footing.
This article by Simply Wall St is general in nature. We provide commentary based on historical data and analyst forecasts only using an unbiased methodology and our articles are not intended to be financial advice. It does not constitute a recommendation to buy or sell any stock, and does not take account of your objectives, or your financial situation. We aim to bring you long-term focused analysis driven by fundamental data. Note that our analysis may not factor in the latest price-sensitive company announcements or qualitative material. Simply Wall St has no position in any stocks mentioned.