Reassessing Allstate (ALL) After A Strong Multi Year Share Price Run
Allstate Corporation ALL | 207.03 | +1.44% |
- If you are wondering whether Allstate's current share price lines up with its underlying value, you are not alone. This article is built to help you size that up clearly.
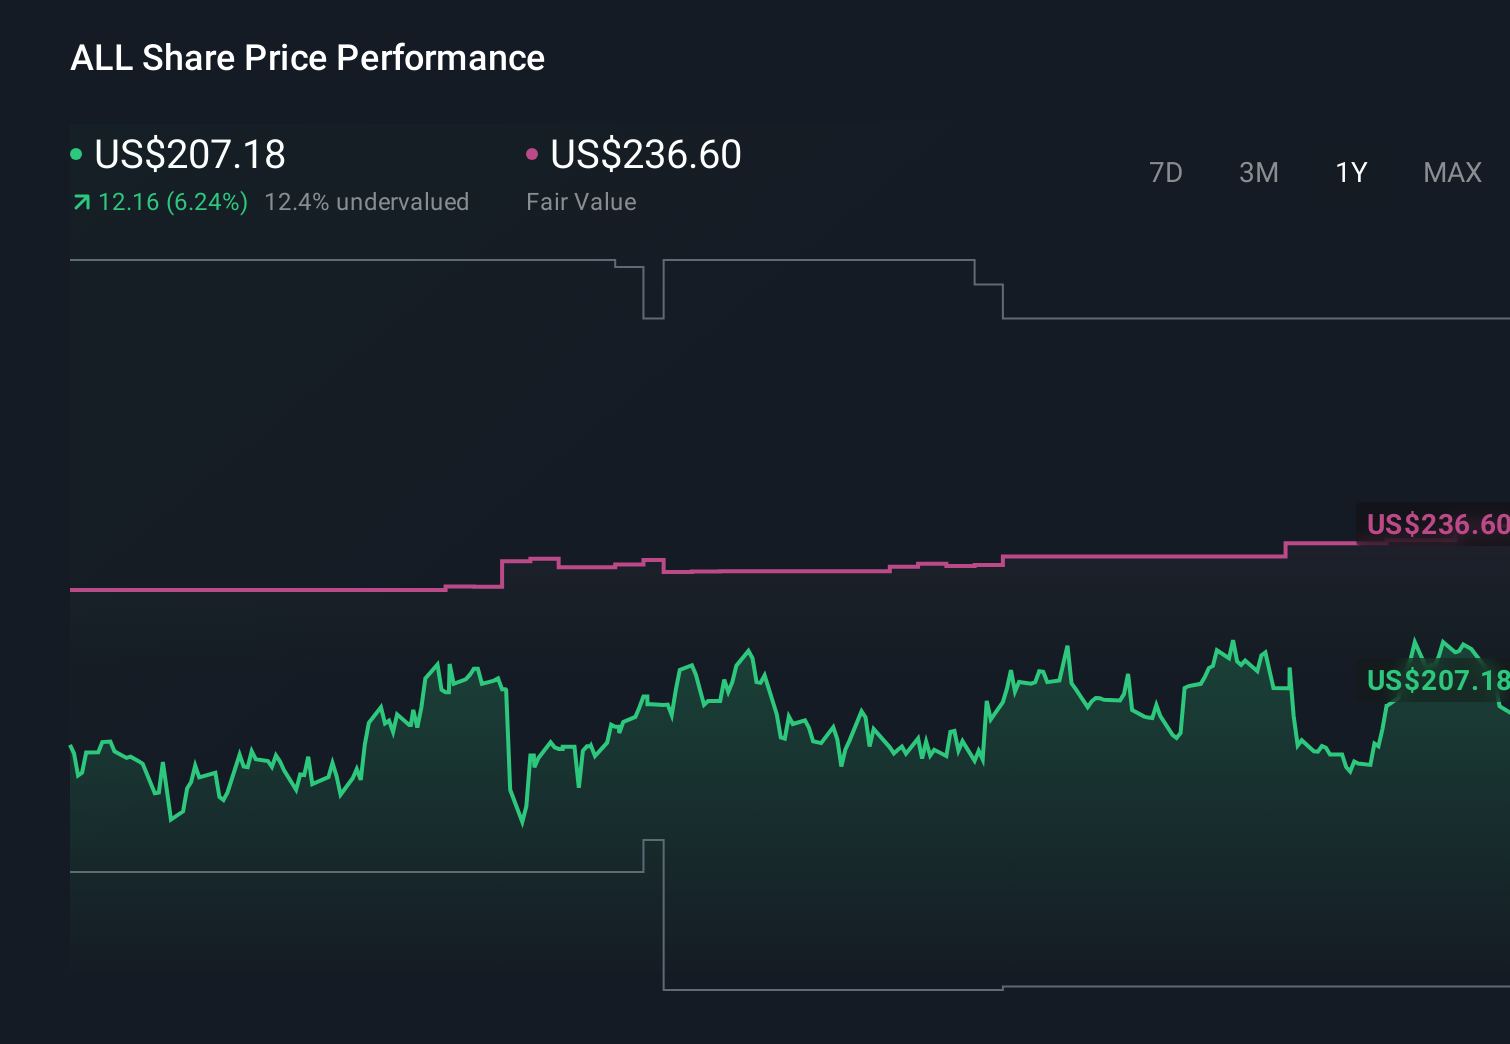
- Allstate's stock recently closed at US$198.99, with returns of 2.8% over 7 days, a 4.4% decline over 30 days, a 2.4% decline year to date, and gains of 5.5% over 1 year, 62.5% over 3 years, and 110.5% over 5 years.
- Recent coverage around Allstate has focused on how investors are reassessing insurers in light of shifting risk perceptions and changing expectations for the sector. This has kept attention on whether current prices fairly reflect the business, especially after a strong multi year run.
- On our valuation checks, Allstate scores 5 out of 6. This 5/6 valuation score hints at possible mismatches between price and fundamentals that we will unpack using several standard valuation approaches, before finishing with a more holistic way to think about value at the end of this article.
Approach 1: Allstate Excess Returns Analysis
The Excess Returns model looks at how efficiently Allstate turns shareholder capital into profits, then compares those profits with the required return that equity investors expect. The gap between the two is the excess return, which is then capitalised into an intrinsic value per share.
For Allstate, the starting point is a Book Value of US$97.34 per share and a Stable EPS of US$26.07 per share, based on weighted future Return on Equity estimates from 13 analysts. The Average Return on Equity is 19.33%, while the Cost of Equity is US$9.38 per share. That leaves an Excess Return of US$16.69 per share, which is what this model treats as value created above the investor’s required return.
The model also uses a Stable Book Value of US$134.91 per share, sourced from weighted future Book Value estimates from 10 analysts. Combining these inputs leads to an Excess Returns based intrinsic value of about US$586.44 per share. Compared with the recent share price of US$198.99, this implies the stock is about 66.1% undervalued on this framework.
Result: UNDERVALUED
Our Excess Returns analysis suggests Allstate is undervalued by 66.1%. Track this in your watchlist or portfolio, or discover 869 more undervalued stocks based on cash flows.

Approach 2: Allstate Price vs Earnings
For a profitable business like Allstate, the P/E ratio is a straightforward way to link what you pay today with the earnings the company is currently generating. It helps you see how many dollars investors are paying for each dollar of earnings.
What counts as a reasonable P/E usually reflects how the market views a company’s growth potential and risk. Higher expected growth or lower perceived risk can support a higher multiple, while lower growth or higher risk tends to justify a lower one.
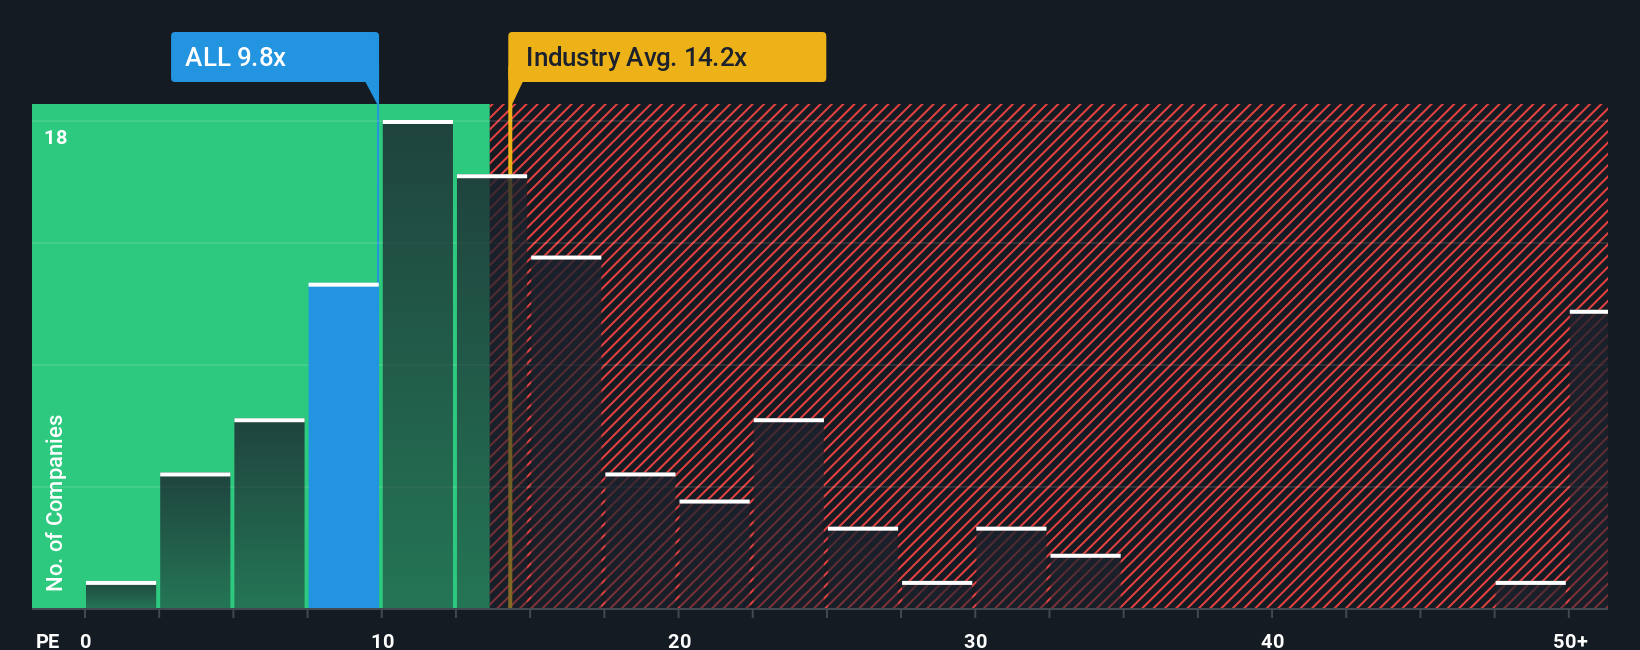
Allstate currently trades on a P/E of 6.30x. That is below both the Insurance industry average P/E of 13.11x and a peer group average of 12.13x. Simply Wall St’s Fair Ratio for Allstate is 9.60x, which is a proprietary estimate of what P/E might make sense given its earnings profile, industry, profit margins, market cap and risk factors.
The Fair Ratio can be more useful than a straight peer or industry comparison because it adjusts for company specific traits instead of assuming all insurers should trade on the same multiple. With Allstate’s actual P/E of 6.30x sitting below the Fair Ratio of 9.60x, this framework points to the shares looking undervalued on earnings.
Result: UNDERVALUED
P/E ratios tell one story, but what if the real opportunity lies elsewhere? Discover 1419 companies where insiders are betting big on explosive growth.
Upgrade Your Decision Making: Choose your Allstate Narrative
Earlier we mentioned that there is an even better way to understand valuation, so let us introduce you to Narratives, which are simply your story about a company linked directly to your own assumptions for fair value, future revenue, earnings and margins.
A Narrative connects what you believe about Allstate’s business, such as how it competes or manages risk, to a financial forecast and then to a fair value that you can compare with today’s share price to help you decide whether you see it as an opportunity or something to avoid.
On Simply Wall St’s Community page, used by millions of investors, Narratives are an easy tool where you can see different forecasts and fair values side by side. They automatically refresh when new information such as earnings releases or major news is added to the platform.
For example, one Allstate Narrative might assume a higher fair value because it expects stronger profitability and a lower discount rate, while another might set a lower fair value based on more conservative assumptions for revenue growth and margins.
Do you think there's more to the story for Allstate? Head over to our Community to see what others are saying!
This article by Simply Wall St is general in nature. We provide commentary based on historical data and analyst forecasts only using an unbiased methodology and our articles are not intended to be financial advice. It does not constitute a recommendation to buy or sell any stock, and does not take account of your objectives, or your financial situation. We aim to bring you long-term focused analysis driven by fundamental data. Note that our analysis may not factor in the latest price-sensitive company announcements or qualitative material. Simply Wall St has no position in any stocks mentioned.