Reassessing Revolve Group (RVLV) Valuation After Mixed Share Performance And Premium P/E Multiple
Revolve Group RVLV | 25.03 25.03 | -0.20% 0.00% Pre |
Recent share performance and business snapshot
Revolve Group (RVLV) has seen mixed share performance recently, with a roughly 17% decline over the past month, contrasting with a gain of about 20% over the past 3 months.
Against that backdrop, the online fashion retailer is operating with annual revenue of about US$1.20b and net income of roughly US$55.5m. It serves millennial and Gen Z consumers through its REVOLVE and FWRD segments.
At a share price of US$25.09, Revolve Group has recently seen a 17.11% 1 month share price decline and a 19.70% 3 month share price gain. This suggests momentum has cooled after a short term rebound, while the 1 year total shareholder return of 19.32% and 5 year total shareholder return of 32.81% indicate longer term holders have faced pressure.
If fashion e commerce volatility has you looking wider, this could be a good moment to scan our list of 23 top founder-led companies for other potential ideas.
So with Revolve Group posting annual revenue of about US$1.20b, net income of roughly US$55.5m and a share price sitting near US$25, investors may be considering whether this represents a genuine opportunity or whether the market is already pricing in future growth.
Most Popular Narrative: 14% Undervalued
Revolve Group's most followed narrative points to a fair value of about $29.07 per share, compared with the recent close at $25.09. This suggests a valuation gap built on specific growth, margin, and discount rate assumptions.
Data-driven personalization, enhanced AI-powered search and merchandising, and increased efficiency in marketing campaigns are boosting average revenue per active customer and expected to improve customer retention, driving future topline and margin expansion.
Read the complete narrative. Read the complete narrative.
Want to see what kind of revenue growth and margin profile needs to hold for that higher fair value to align with the model? The narrative focuses on improving profitability, steady expansion in new regions, and a richer mix of owned and luxury brands to support the assumptions. The full breakdown explains how those elements tie into the discount rate and the earnings power that underpin the $29.07 figure.
Result: Fair Value of $29.07 (UNDERVALUED)
However, this hinges on trends holding up, with tariff volatility and any missteps in owned brand inventory having the potential to pressure margins and earnings.
Another View: Multiples Paint A Tougher Picture
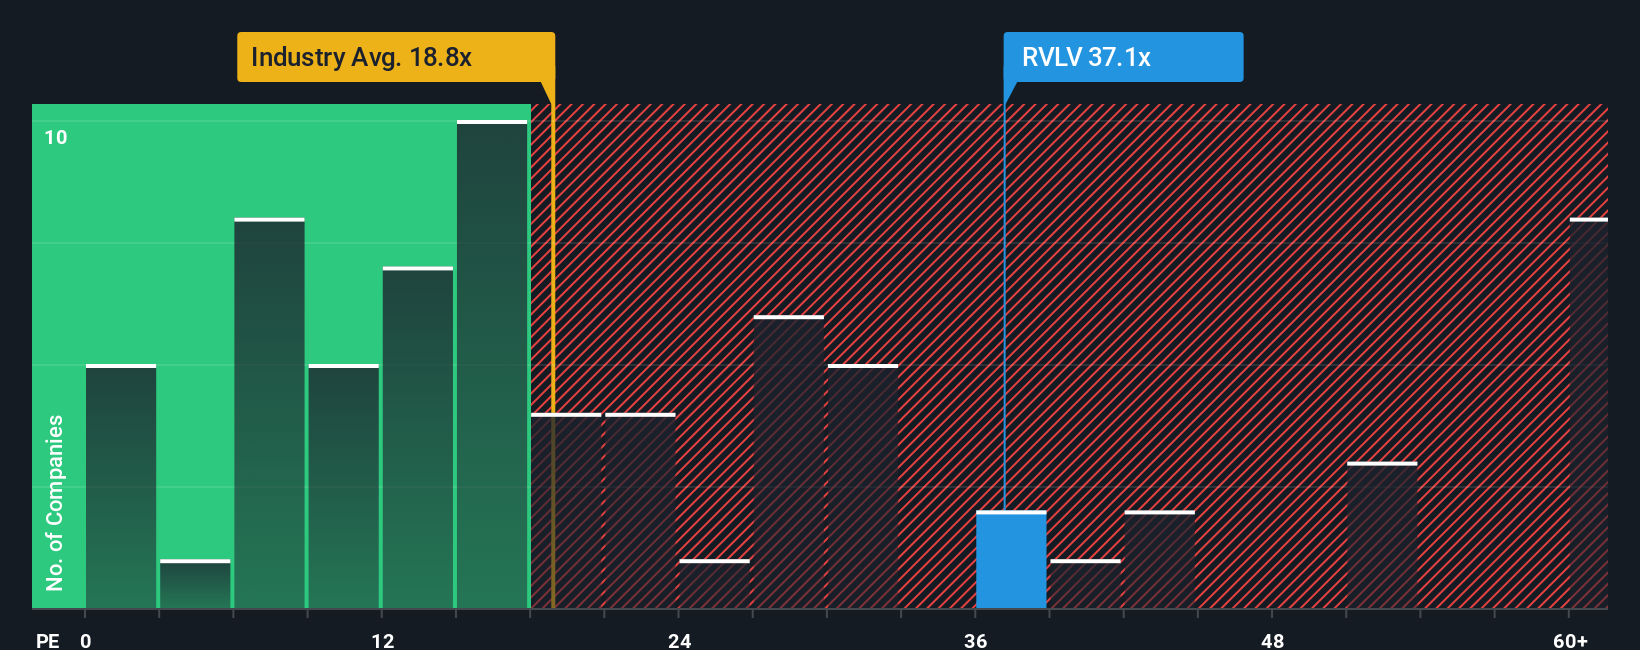
While the most popular narrative points to fair value above the current $25.09 share price, the current P/E of 32.3x sends a different signal. That is much higher than the US Specialty Retail average of 20.5x, the peer average of 16x, and a fair ratio of 15.3x.
This gap suggests valuation risk if the market moves closer to that fair ratio or peer levels instead. It raises a simple question for you: are you comfortable paying a premium multiple for Revolve Group given its recent share performance and current earnings profile?
Build Your Own Revolve Group Narrative
If parts of this story do not quite fit how you see Revolve Group, take a few minutes to test the numbers yourself and Do it your way.
A good starting point is our analysis highlighting 2 key rewards investors are optimistic about regarding Revolve Group.
Looking for more investment ideas?
If Revolve Group has sparked your interest, do not stop here, broaden your watchlist with a few focused stock ideas that could sharpen your next move.
- Spot potential value by scanning our 53 high quality undervalued stocks and see which companies currently trade below what their fundamentals may justify.
- Strengthen your income game with 13 dividend fortresses, highlighting companies that pair higher yields with an emphasis on stability.
- Sleep a little easier by reviewing 85 resilient stocks with low risk scores, featuring businesses that score well on financial resilience and risk metrics.
This article by Simply Wall St is general in nature. We provide commentary based on historical data and analyst forecasts only using an unbiased methodology and our articles are not intended to be financial advice. It does not constitute a recommendation to buy or sell any stock, and does not take account of your objectives, or your financial situation. We aim to bring you long-term focused analysis driven by fundamental data. Note that our analysis may not factor in the latest price-sensitive company announcements or qualitative material. Simply Wall St has no position in any stocks mentioned.