Reassessing Veeva Systems (VEEV) After Recent Share Price Pullback
Veeva Systems Inc Class A VEEV | 166.57 | -3.45% |
- If you are asking yourself whether Veeva Systems at around US$190.80 is a fair deal or not, this article is designed to walk you through the key signals that matter most for valuation.
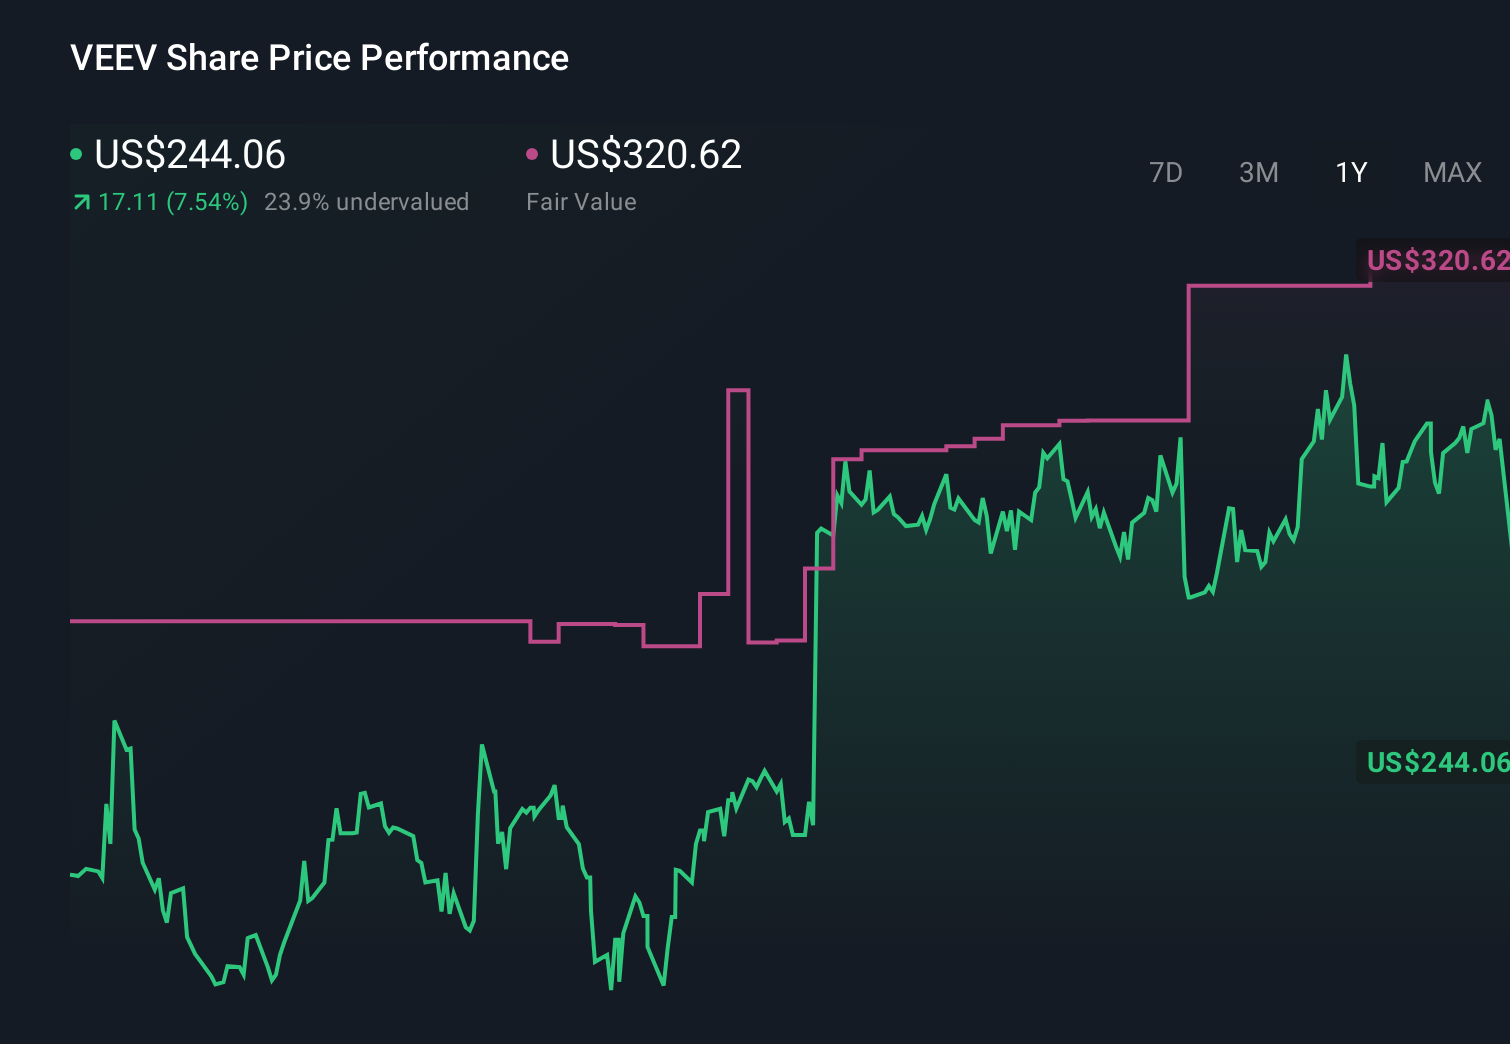
- The stock price has recently been under pressure, with returns of 12.4% over 7 days, 13.1% over 30 days, 13.1% year to date and 18.2% over the last year.
- Recent coverage has focused on how investors are reassessing growth oriented software names, with Veeva Systems often cited as a reference point for quality in healthcare related cloud platforms. At the same time, commentators have pointed to the share price pullback as a sign that expectations around future growth and risk are being carefully reconsidered.
- On our valuation checks, Veeva Systems scores 4 out of 6. You can see the breakdown of that score here. Next we will look at the main valuation approaches behind that result and later in the article introduce a framework that can help you make even more sense of what that score really means.
Approach 1: Veeva Systems Discounted Cash Flow (DCF) Analysis
A Discounted Cash Flow, or DCF, model projects a company’s future cash flows and then discounts them back to today’s dollars in order to estimate what the entire business might be worth at present.
For Veeva Systems, the model used is a 2 Stage Free Cash Flow to Equity approach based on cash flow projections. The latest twelve month free cash flow is about $1.35b, and analysts and internal estimates project annual free cash flows that reach around $2.46b by 2031. These figures, all in $, are discounted back using a required rate of return, which gives more weight to cash generated sooner and less weight to cash expected further out.
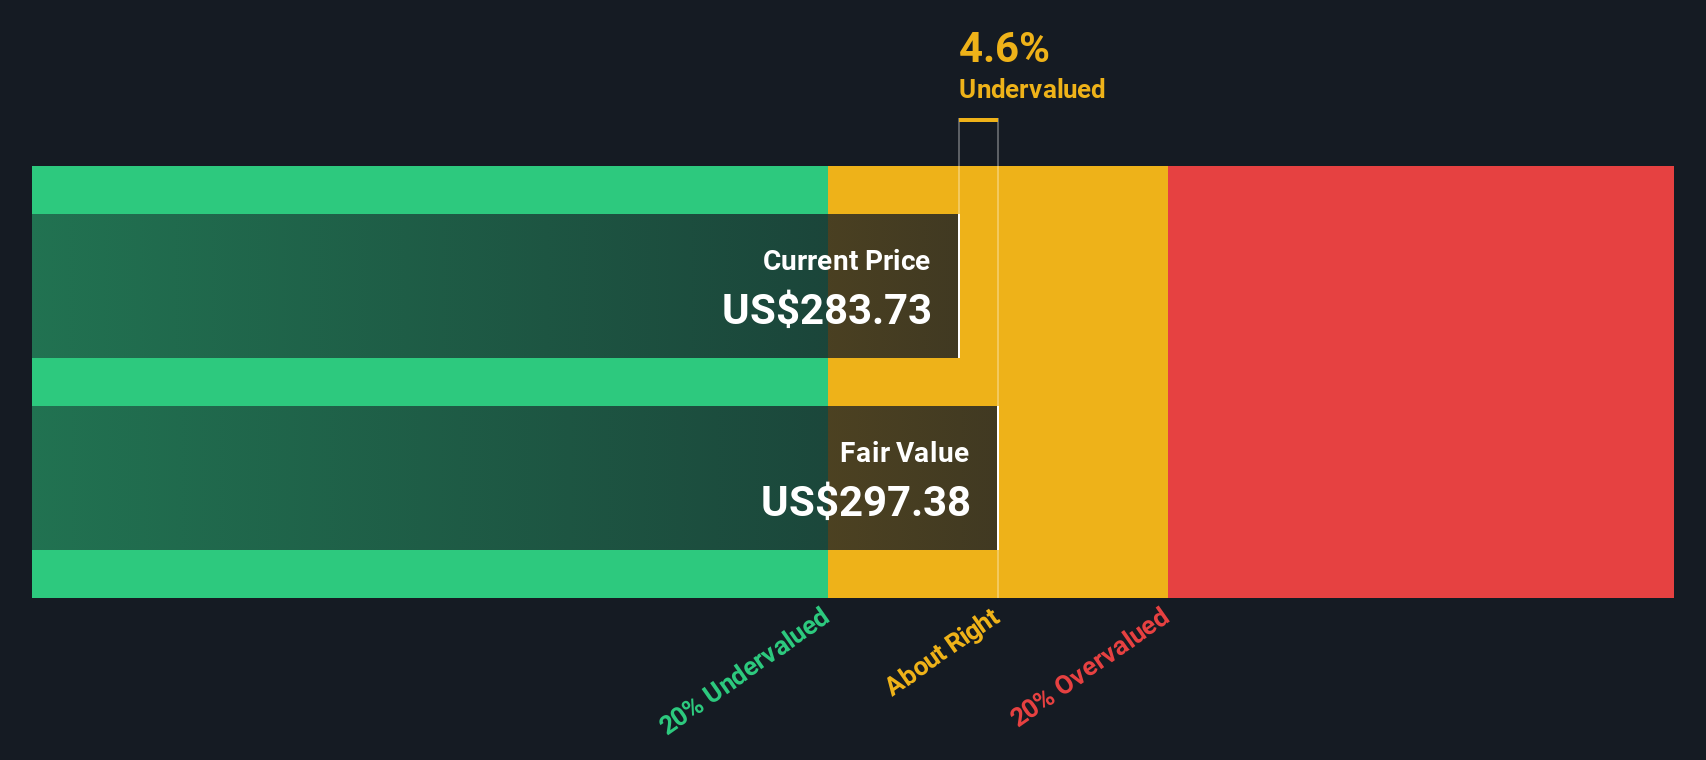
Based on these inputs, the DCF model suggests an estimated intrinsic value of about $251.32 per share. Compared with the recent share price around $190.80, this implies an intrinsic discount of roughly 24.1%, indicating that Veeva Systems is trading at a level below this cash flow based estimate.
Result: UNDERVALUED
Our Discounted Cash Flow (DCF) analysis suggests Veeva Systems is undervalued by 24.1%. Track this in your watchlist or portfolio, or discover 873 more undervalued stocks based on cash flows.
Approach 2: Veeva Systems Price vs Earnings
For profitable companies, the P/E ratio is a useful way to connect what you pay for each share with the earnings the business is currently generating. It lets you compare the market’s pricing of one company’s profits with those of its sector and the wider market.
What counts as a “normal” or “fair” P/E depends on how the market views a company’s growth potential and risk. Higher expected growth or lower perceived risk can justify a higher multiple, while slower growth or higher risk usually point to a lower one.
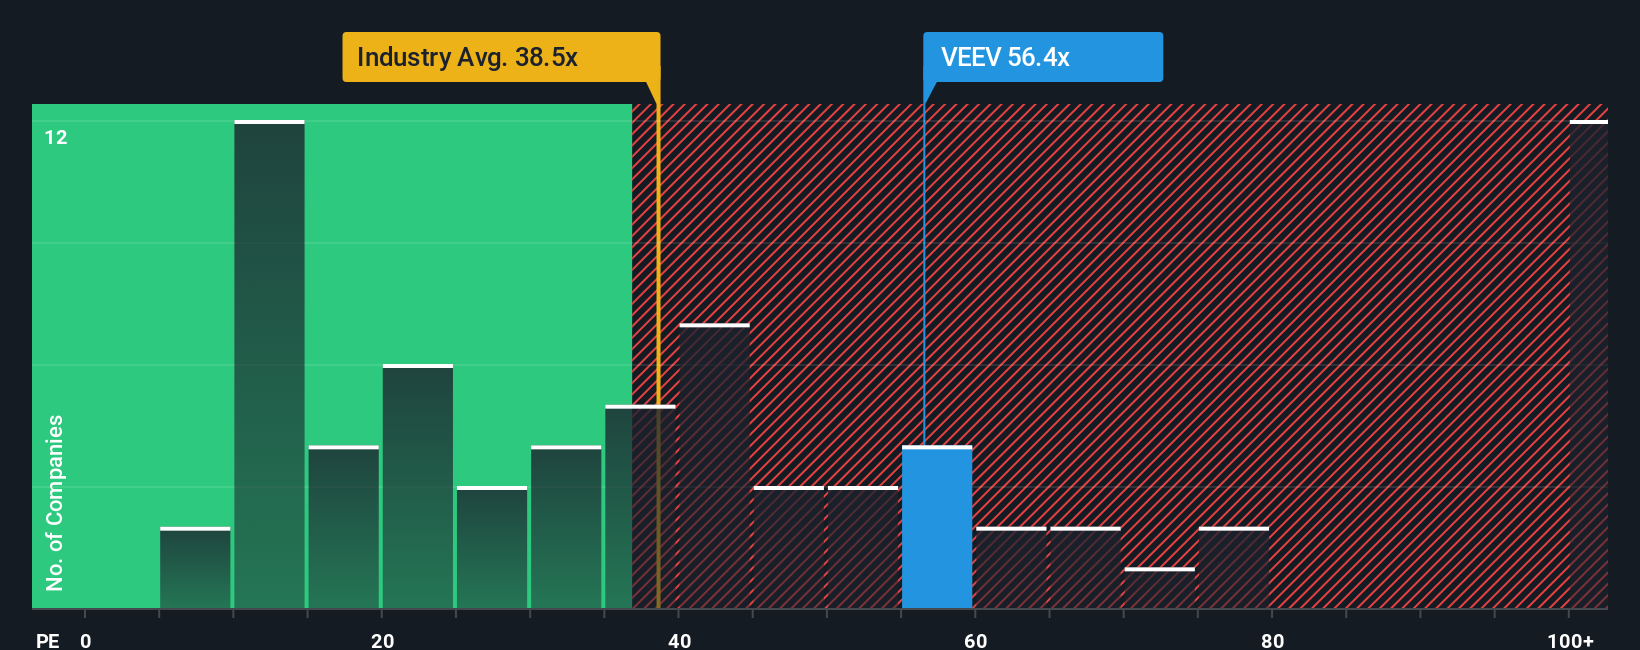
Veeva Systems currently trades on a P/E of 36.46x. That is above the Healthcare Services industry average of about 30.52x, and below the peer group average of 51.17x. Simply Wall St’s Fair Ratio for Veeva Systems is 31.27x, which is a proprietary estimate of the P/E that might be expected given factors such as earnings growth, industry, profit margins, market cap and risk profile.
The Fair Ratio can be more informative than a simple industry or peer comparison because it adjusts for those company specific features rather than assuming all businesses deserve similar multiples. With the current P/E at 36.46x versus a Fair Ratio of 31.27x, the shares appear to be priced above this custom benchmark.
Result: OVERVALUED
P/E ratios tell one story, but what if the real opportunity lies elsewhere? Discover 1426 companies where insiders are betting big on explosive growth.
Upgrade Your Decision Making: Choose your Veeva Systems Narrative
Earlier we mentioned that there is an even better way to understand valuation, so let us introduce you to Narratives, which are simply your story about a company, tied directly to your own assumptions for fair value, future revenue, earnings and margins. On Simply Wall St, Narratives live in the Community page and let you connect three pieces in one place: how you think Veeva Systems’ business will evolve, the financial forecast that follows from that view, and the fair value that drops out of those numbers. You can then compare that fair value to today’s share price to help you decide whether Veeva Systems looks attractive, fairly priced, or expensive on your assumptions, and your Narrative will automatically refresh as new information like earnings releases or news is added to the platform. For example, some investors may build a Veeva Systems Narrative that expects much higher revenue growth and a richer fair value than others who assume slower growth and a lower fair value, and you can see both side by side and decide which story makes more sense to you.
Do you think there's more to the story for Veeva Systems? Head over to our Community to see what others are saying!
This article by Simply Wall St is general in nature. We provide commentary based on historical data and analyst forecasts only using an unbiased methodology and our articles are not intended to be financial advice. It does not constitute a recommendation to buy or sell any stock, and does not take account of your objectives, or your financial situation. We aim to bring you long-term focused analysis driven by fundamental data. Note that our analysis may not factor in the latest price-sensitive company announcements or qualitative material. Simply Wall St has no position in any stocks mentioned.