Red Cat (RCAT) Stock Looks Fully Priced Following Its 7x Three Year Run
RED CAT HOLDINGS RCAT | 0.00 |
Red Cat Holdings stock has produced a very strong multi year return, yet the broad valuation checks currently paint it as expensive rather than a clear bargain.
- Over the past three years, Red Cat Holdings has delivered a very large share price gain of about 7x, which sets a high bar for any further upside.
- Investor optimism around Red Cat Holdings' emerging role in military drones and new products like the Hellcat system can support rich expectations, while concerns about shareholder dilution and supply chain restrictions may weigh on what investors are willing to pay for that growth.
- Red Cat Holdings passes just 1 of 6 valuation checks, which suggests the stock currently leans expensive on the broader measures.
The issue now is whether Red Cat Holdings' recent gains and business momentum are enough to justify the premium signals coming through the valuation checks.
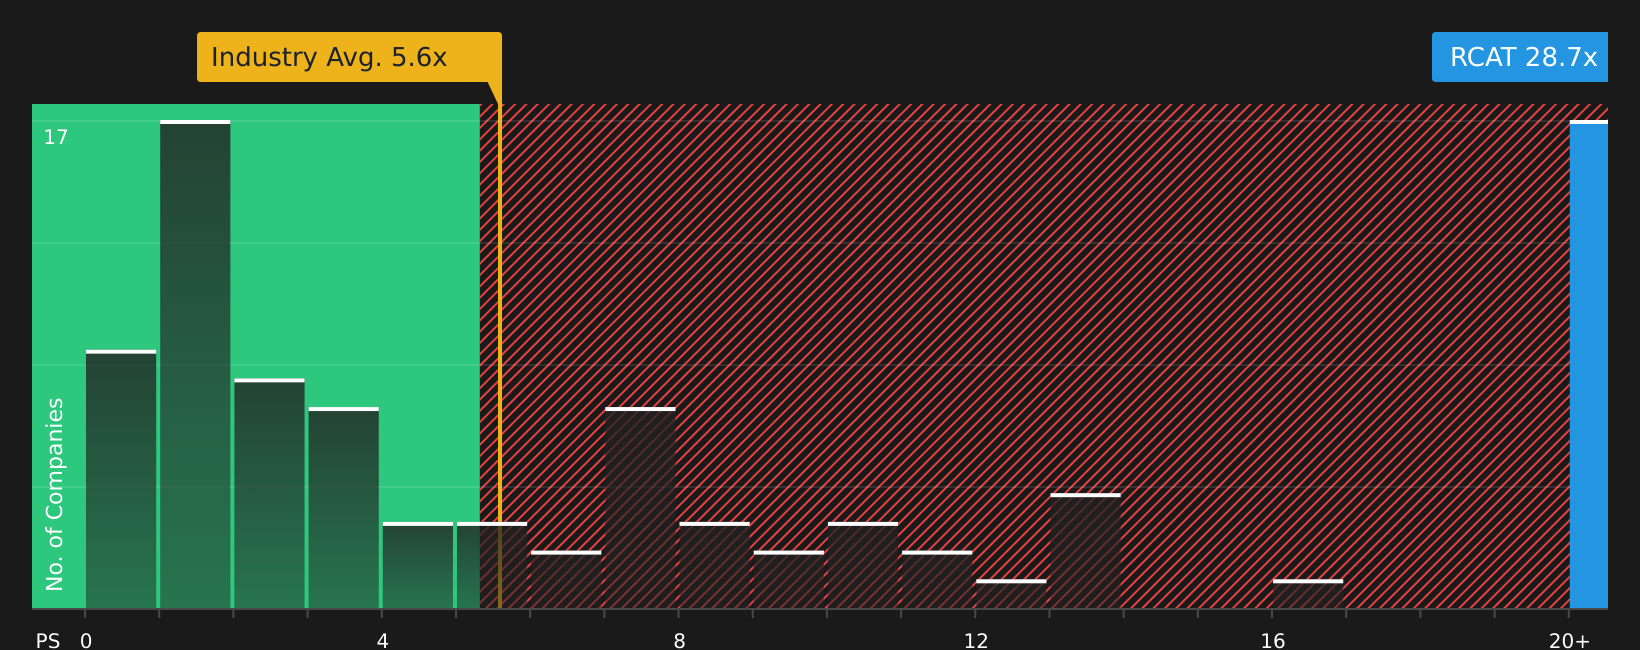
Does Red Cat Holdings Look Pricey on Sales?
P/S is a useful lens for Red Cat Holdings because the company is still loss making and investors are mostly paying for its revenue base and potential scale. On this metric, Red Cat trades on a P/S of about 29.1x, compared with an Aerospace & Defense industry average of 5.6x and a peer average of 15.7x, so the stock sits at a markedly higher revenue multiple than its sector.
The fair P/S ratio implied by the model is about 6.1x, and the large gap to the current 29.1x suggests Red Cat Holdings screens as overvalued on this framework. Because the gap is so wide, the model is heavily penalising the company’s current losses and risk profile. This fair multiple is better read as a flag that investors are paying a steep premium for each dollar of sales rather than as a precise target. Despite the launch of the Hellcat drone and interest around Red Cat’s defense positioning, the P/S suggests expectations already embed a lot of optimism into the share price.
On a P/S basis, Red Cat Holdings stock currently looks overvalued relative to both its own fundamentals model and typical aerospace and defense peers.
The Red Cat Holdings Narrative: What Would Justify Today's Price?
Simply Wall St Narratives for Red Cat Holdings pick up where the valuation puzzle leaves off, spelling out which paths for revenue growth, margins and future earnings would line up with a higher or lower share price than today. Each narrative ties its implied number to a clear view of how Red Cat Holdings' growth, profitability and risks could evolve, giving you a reference point you can revisit as fresh information comes through.
One of the top community narratives on Red Cat Holdings: 38% undervalued
"Expansion into uncrewed surface vessels through Blue Ops, with planned capacity for 500 to 1,000 vessels per year and unit pricing mentioned between about US$750,000 and US$1.5 million, adds a second major product line..."
Do you think there's more to the story for Red Cat Holdings? Head over to our Community to see what others are saying!
The Bottom Line
For Red Cat Holdings, the valuation story centers on a very rich P/S multiple that already bakes in optimistic expectations. The stock screens as overvalued on broad checks, with an extreme gap between current pricing and the fair multiple indicator as losses and risk are penalised. From this point, the key question is whether Red Cat Holdings can grow into that premium through sustained revenue scale and improved profitability, or whether sentiment cools and the multiple settles closer to sector norms.
This article by Simply Wall St is general in nature. We provide commentary based on historical data and analyst forecasts only using an unbiased methodology and our articles are not intended to be financial advice. It does not constitute a recommendation to buy or sell any stock, and does not take account of your objectives, or your financial situation. We aim to bring you long-term focused analysis driven by fundamental data. Note that our analysis may not factor in the latest price-sensitive company announcements or qualitative material. Simply Wall St has no position in any stocks mentioned.