Rivian (RIVN) Stock After 20% Rebound Is The Recent Rally Justified?
Rivian Automotive RIVN | 0.00 |
- If you are wondering whether Rivian Automotive stock still offers value at around US$16.52, it helps to start by looking at what the recent price action and news are really telling you.
- Over the past month the share price has risen about 20.3%, even though the stock is still down about 14.9% year to date and the last week saw a modest decline of around 1.4%, leaving the 1 year return at roughly 21.7%.
- Recent headlines around Rivian Automotive have focused on its position in the electric vehicle market and how investors are reassessing growth expectations and risks in the sector. This backdrop provides useful context for the mix of short term volatility and longer term returns seen in the stock.
- Rivian Automotive currently has a valuation score of 2 out of 6, which reflects how many of Simply Wall St's valuation checks suggest the stock may be undervalued. The next sections will compare different valuation approaches and then finish with a broader way to think about what that score really means for investors.
Rivian Automotive scores just 2/6 on our valuation checks. See what other red flags we found in the full valuation breakdown.
Approach 1: Rivian Automotive Discounted Cash Flow (DCF) Analysis
A Discounted Cash Flow, or DCF, model estimates what Rivian Automotive stock could be worth by projecting future cash flows and then discounting them back to today, using a required rate of return. It is essentially asking what all those future cash flows are worth in present dollar terms.
For Rivian Automotive, the latest twelve month free cash flow is a loss of about $2.7b. Analyst estimates and extrapolations used by Simply Wall St point to free cash flow staying negative for several years, then turning positive. The projection for 2030 is free cash flow of about $1.5b, with further increases estimated out to 2035 based on the 2 Stage Free Cash Flow to Equity model.
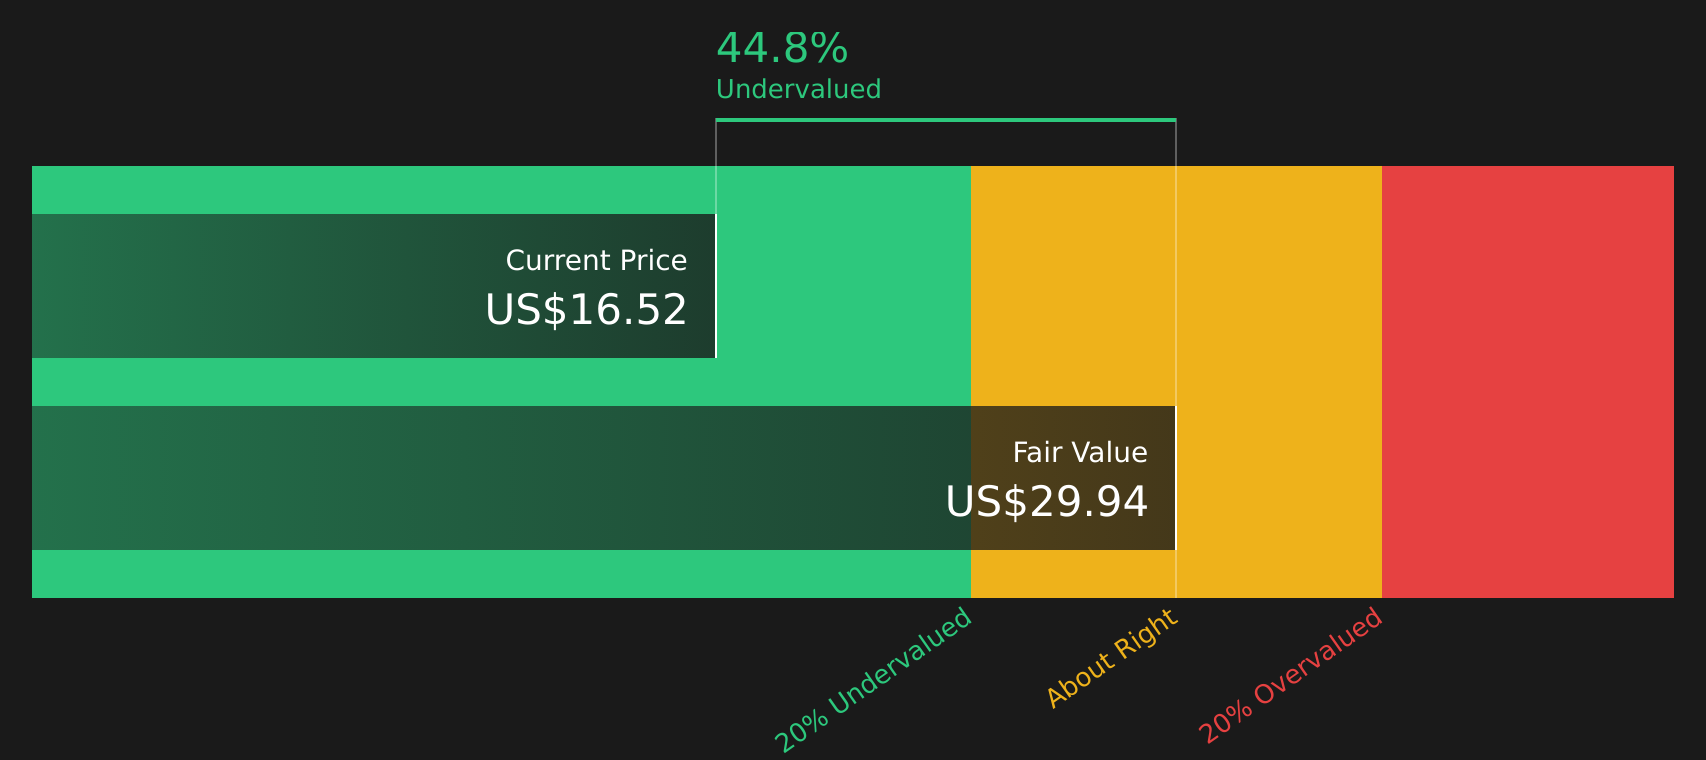
When all of these projected cash flows are discounted back, the model arrives at an estimated intrinsic value of about $29.94 per share. Compared with the recent share price of around $16.52, this particular DCF output suggests the stock is trading at roughly a 44.8% discount to that intrinsic value. On this measure alone, the stock appears to be potentially undervalued.
Result: UNDERVALUED
Our Discounted Cash Flow (DCF) analysis suggests Rivian Automotive is undervalued by 44.8%. Track this in your watchlist or portfolio, or discover 45 more high quality undervalued stocks.
Approach 2: Rivian Automotive Price vs Sales
For a company like Rivian Automotive that is focused on growing revenue and is not yet consistently profitable, the Price to Sales, or P/S, ratio is often more useful than earnings based metrics. It ties the share price directly to the revenue investors are currently willing to pay for each dollar of sales.
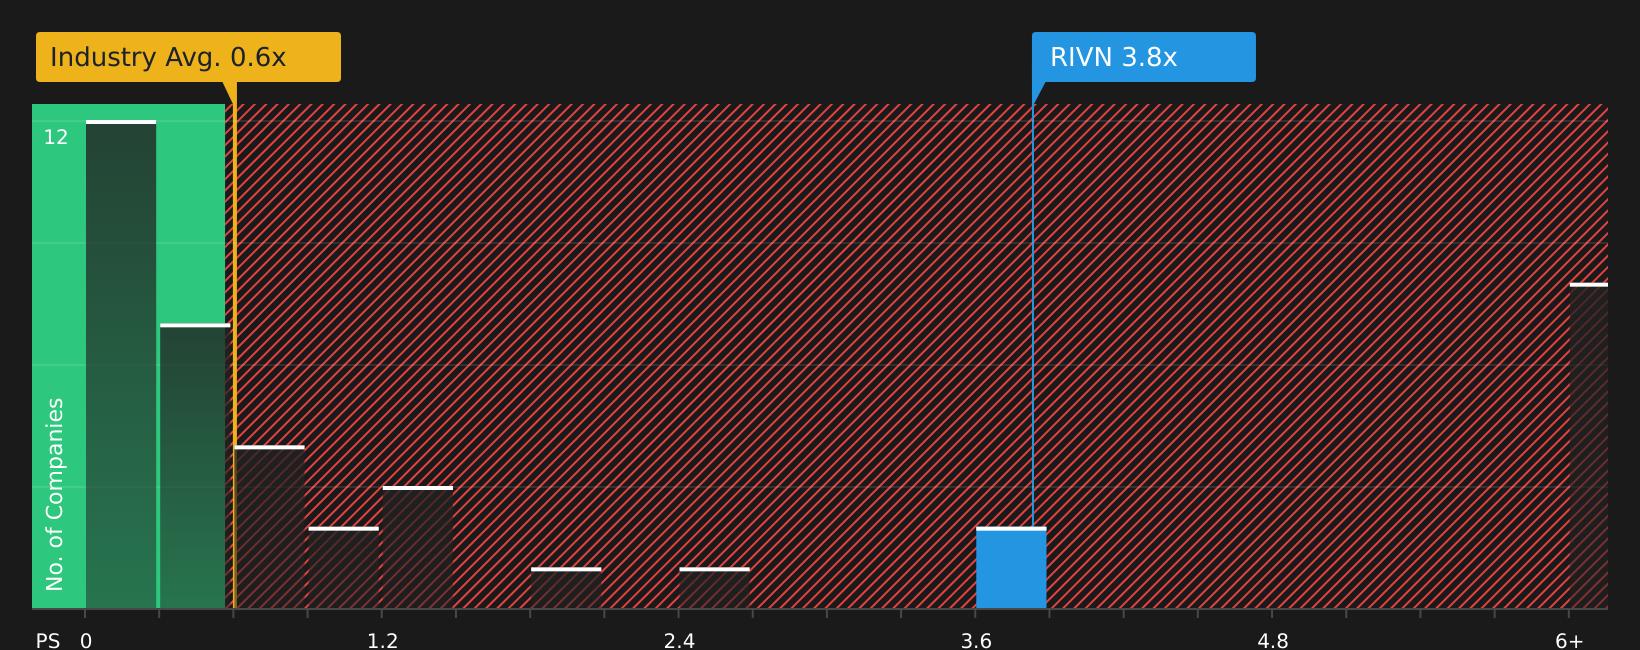
In general, higher growth expectations and lower perceived risk can support a higher P/S multiple. In contrast, slower expected growth or higher risk tend to align with a lower, more conservative multiple. Rivian Automotive is currently trading on a P/S ratio of about 3.83x. This is above the Auto industry average P/S of roughly 0.59x and also above the peer group average of about 0.78x.
Simply Wall St’s Fair Ratio for Rivian Automotive is 1.93x. This is a proprietary estimate of what a reasonable P/S multiple might be, given factors such as expected earnings growth, profit margins, risks, market capitalization and the industry context. Because it adjusts for these company specific characteristics, the Fair Ratio can be more informative than a simple comparison with industry or peer averages. Comparing the Fair Ratio of 1.93x with the current P/S of 3.83x suggests the stock may be trading above that fair level.
Result: OVERVALUED
P/S ratios tell one story, but what if the real opportunity lies elsewhere? Start investing in legacies, not executives. Discover our 20 top founder-led companies.
Upgrade Your Decision Making: Choose your Rivian Automotive Narrative
Earlier it was mentioned that there is an even better way to think about valuation, and that is through Narratives. These let you attach a clear story about Rivian Automotive to the numbers you are seeing, link that story to a forecast for revenue, earnings and margins, and then compare your own fair value to today’s price in a simple view inside the Simply Wall St Community page.
A Narrative is essentially your structured perspective on the company. It is captured as assumptions about things like how quickly revenue might grow, what profit margins could look like and what P/E or P/S multiples might be reasonable, so you are not just reacting to a single target price but grounding it in a story you actually agree with.
Because Narratives on Simply Wall St are updated automatically when new information appears, such as earnings releases, partnership announcements or changes in analyst targets, you can see how the implied fair value for Rivian Automotive moves relative to the live market price. You can then use that gap to help decide whether you see the stock as priced above or below what your story suggests.
For example, one investor might lean toward the more cautious scenario that lines up with a fair value near US$9.42, while another might be closer to the optimistic camp at US$25.00. Narratives make those different views transparent so you can choose or adjust the version of Rivian Automotive that best reflects your own expectations rather than relying on a single headline number.
For Rivian Automotive, however, we will make it really easy for you with previews of two leading Rivian Automotive Narratives:
Fair value: US$18.15 per share
Implied discount to this fair value at US$16.52: about 9.0%
Revenue growth assumption: 51.29% a year
- Analysts see the R2 platform and manufacturing efficiency improvements as central to Rivian Automotive's route toward stronger margins and a clearer path to profitability.
- Partnerships in software, autonomy and commercial fleets are expected to broaden revenue sources and support earnings quality over time.
- The consensus price target of US$18.15, with a range from US$9.00 to US$25.00, reflects a view that the current share price sits close to what analysts collectively see as fair, based on their assumptions.
Fair value: US$9.42 per share
Implied premium to this fair value at US$16.52: about 75.3%
Revenue growth assumption: 34.89% a year
- More cautious analysts focus on reduced policy support, higher costs and execution risks that could keep Rivian Automotive's margins and cash flow under pressure.
- They assume solid revenue growth but still see the need for a high future P/E multiple, which raises questions about how easily that valuation could be supported.
- On this view, the US$9.42 fair value sits well below the recent share price, so the current market valuation is seen as requiring more optimistic assumptions than this bear case is prepared to use.
Both viewpoints use the same company data but apply different assumptions about how quickly Rivian Automotive can scale R2, improve profitability and manage funding needs. This is why the Simply Wall St Community encourages you to compare these narratives and decide which set of assumptions you find more realistic for your own thesis on the stock.
Do you think there's more to the story for Rivian Automotive? Head over to our Community to see what others are saying!

This article by Simply Wall St is general in nature. We provide commentary based on historical data and analyst forecasts only using an unbiased methodology and our articles are not intended to be financial advice. It does not constitute a recommendation to buy or sell any stock, and does not take account of your objectives, or your financial situation. We aim to bring you long-term focused analysis driven by fundamental data. Note that our analysis may not factor in the latest price-sensitive company announcements or qualitative material. Simply Wall St has no position in any stocks mentioned.