Rivian (RIVN) Stock After Recent 11% Weekly Jump Is The Price Now Attractive
Rivian Automotive RIVN | 0.00 |
- If you are wondering whether Rivian Automotive shares are starting to look attractively priced or still carry a premium, the current valuation picture offers some clear signals worth unpacking.
- The stock recently closed at US$16.81, with returns of 11.3% over the past week, 3.1% over the past month, a decline of 13.4% year to date, and a 22.3% gain over the past year. These moves may point to shifting expectations around its risk and potential.
- Recent headlines have focused on Rivian Automotive's position in the electric vehicle space and its efforts to scale production and manage costs. These themes help frame why the share price has moved over different time frames, as investors react to updates on execution and capital needs.
- On Simply Wall St's valuation checks, Rivian Automotive scores 2 out of 6 for being assessed as undervalued. The next sections will break down what different valuation methods say about the stock, before finishing with a broader way to think about value that goes beyond just the numbers.
Rivian Automotive scores just 2/6 on our valuation checks. See what other red flags we found in the full valuation breakdown.
Approach 1: Rivian Automotive Discounted Cash Flow (DCF) Analysis
A Discounted Cash Flow, or DCF, model estimates what Rivian Automotive stock could be worth by projecting future cash flows and then discounting them back to today using a required return. It is essentially asking what those future dollars are worth in present terms.
For Rivian Automotive, the latest twelve month Free Cash Flow (FCF) is a loss of about $2.7b. Analysts and extrapolations then project FCF to move to $1.5b in 2030, based on a 2 Stage Free Cash Flow to Equity model that uses analyst inputs for the earlier years and Simply Wall St extrapolations beyond that horizon.
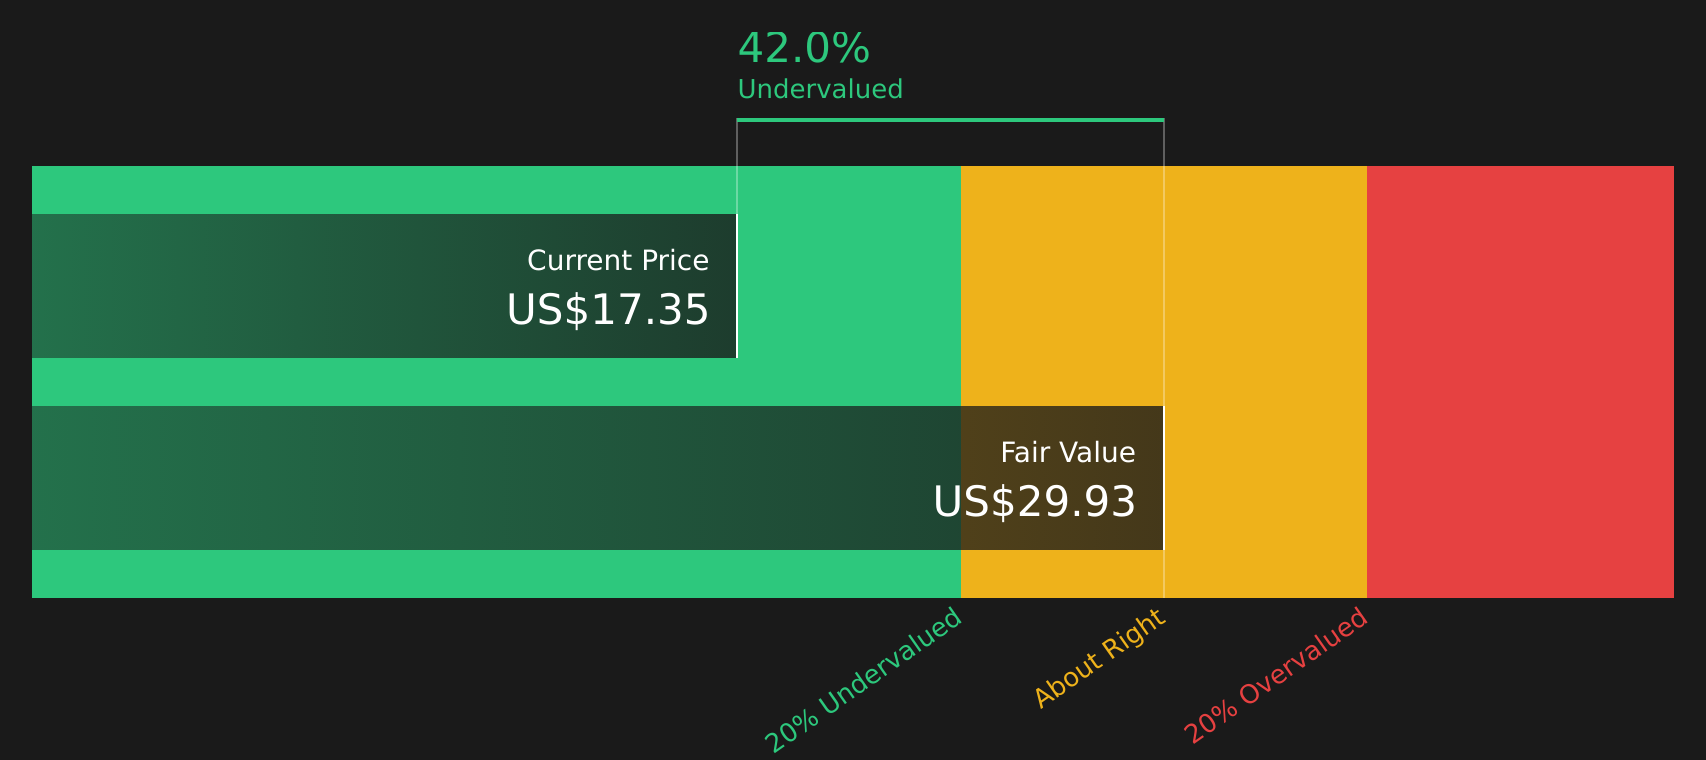
Putting all those projected cash flows into the DCF framework produces an estimated intrinsic value of $29.70 per share. Compared with a recent share price of $16.81, this DCF output points to the stock trading at a discount of around 43.4%, which indicates Rivian Automotive is assessed as undervalued on this model alone.
Result: UNDERVALUED
Our Discounted Cash Flow (DCF) analysis suggests Rivian Automotive is undervalued by 43.4%. Track this in your watchlist or portfolio, or discover 42 more high quality undervalued stocks.
Approach 2: Rivian Automotive Price vs Sales
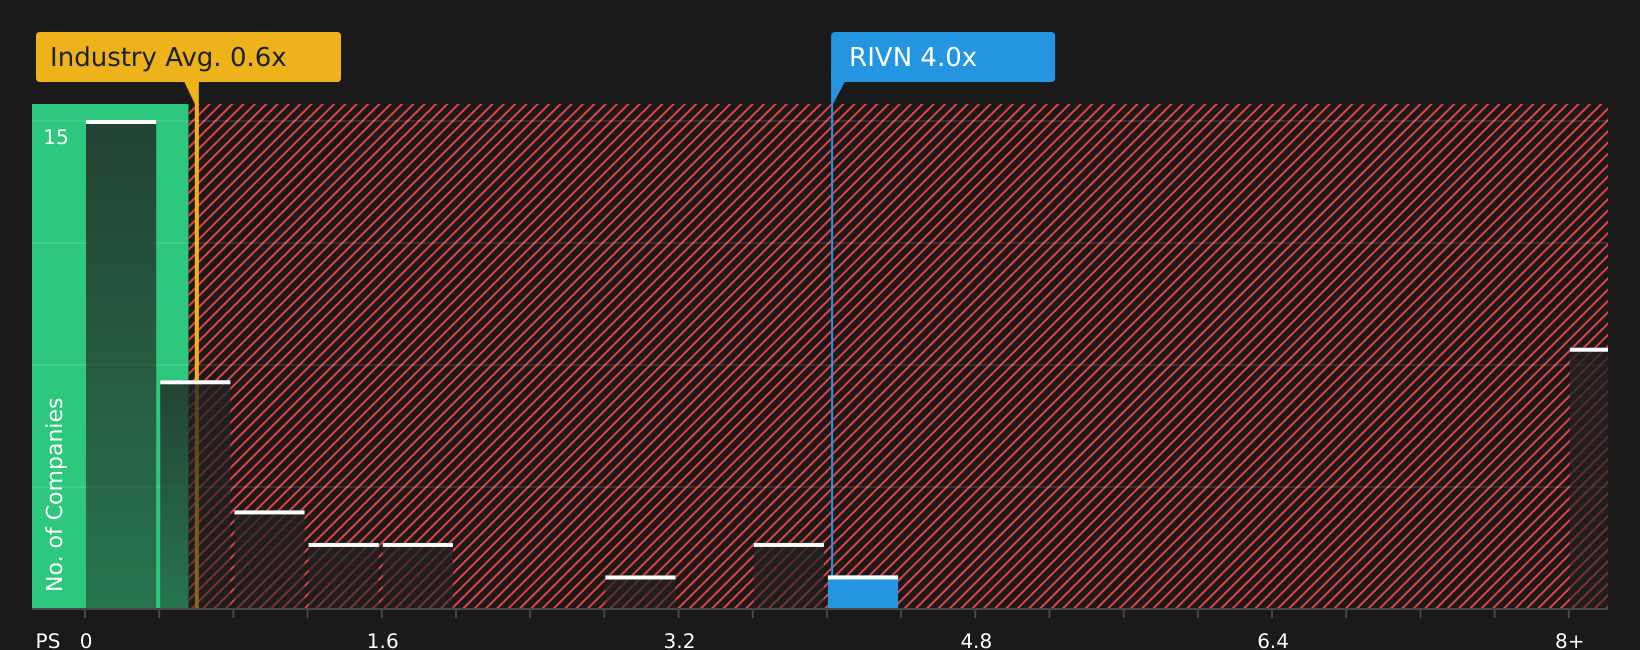
For companies like Rivian Automotive that are still building toward sustained profitability, the Price to Sales, or P/S, ratio is often the cleaner yardstick because it focuses on revenue rather than earnings that may be affected by heavy investment and early stage losses.
In general, the higher a company’s growth expectations and the lower its perceived risk, the higher a “normal” or “fair” valuation multiple tends to be. Slower growth or higher risk usually lines up with a lower multiple. Using the preferred P/S multiple, Rivian Automotive trades at about 3.89x sales. This sits above the Auto industry average of roughly 0.58x and also above the peer group average of about 0.75x.
Simply Wall St’s Fair Ratio for Rivian Automotive is 1.94x, which is its proprietary estimate of what the P/S multiple might be given factors such as growth profile, industry, profit margins, market value and risk. This Fair Ratio goes further than a simple industry or peer comparison because it adjusts for company specific characteristics rather than assuming all Auto stocks deserve similar pricing. Against this yardstick, Rivian Automotive’s current 3.89x P/S suggests the shares are assessed as overvalued on this approach.
Result: OVERVALUED
P/S ratios tell one story, but what if the real opportunity lies elsewhere? Start investing in legacies, not executives. Discover our 20 top founder-led companies.
Upgrade Your Decision Making: Choose your Rivian Automotive Narrative
Earlier the article mentioned that there is an even better way to understand valuation, so Narratives are introduced as a simple way for you to attach a clear story about Rivian Automotive to the numbers you see. They link your view on its products, competition, and funding needs to specific assumptions for future revenue, earnings, margins, and a fair value estimate that can be compared directly with the current share price.
On Simply Wall St, Narratives sit in the Community page and are designed so any investor can use them without complex models. They connect a written thesis to a forecast and fair value that automatically updates when new information such as earnings, news or guidance is added. This helps you judge whether the gap between fair value and price is wide enough to consider buying, selling or holding.
For Rivian Automotive, for example, one Narrative might follow the more cautious fair value around US$9.42 that ties to concerns about ongoing losses and funding. Another might reflect the more optimistic US$25.00 view that focuses on the R2 platform and partnerships. By comparing these side by side you can see how different assumptions about revenue, margins and required return can lead to very different conclusions about what the stock could be worth.
For Rivian Automotive, we will make it really easy for you with previews of two leading Rivian Automotive Narratives:
Fair value: US$18.15 per share
Implied pricing vs fair value: around 7.4% below this narrative fair value at the recent US$16.81 share price
Revenue growth assumption: 51.29% a year
- Analysts in this Narrative see the R2 platform, cost reductions and manufacturing improvements as key drivers toward better margins and a clearer route toward profitability over time.
- They also expect technology partnerships and software or services, including licensing deals, to add higher margin revenue streams on top of vehicle sales.
- In this view, the analyst consensus price target of US$18.15 reflects expectations for revenue of US$19.1b and earnings of US$478.9m by 2029, with the stock trading on a higher future P/E multiple than the wider US Auto industry.
Fair value: US$9.42 per share
Implied pricing vs fair value: around 78.4% above this narrative fair value at the recent US$16.81 share price
Revenue growth assumption: 34.89% a year
- The more cautious Narrative focuses on shrinking EV policy support, higher tariffs and cost inflation, which are seen as pressures on Rivian Automotive margins, cash flow and ability to justify large expansion plans.
- This view highlights ongoing losses, high fixed costs and the risk that weaker demand or tougher competition could keep free cash flow and net margins under strain, increasing the chance of further funding needs.
- In this case, a fair value of US$9.42 is tied to expectations for 2029 revenue of US$13.6b and earnings of US$313.2m, with the current market price sitting well above what these more bearish assumptions would support.
Do you think there's more to the story for Rivian Automotive? Head over to our Community to see what others are saying!

This article by Simply Wall St is general in nature. We provide commentary based on historical data and analyst forecasts only using an unbiased methodology and our articles are not intended to be financial advice. It does not constitute a recommendation to buy or sell any stock, and does not take account of your objectives, or your financial situation. We aim to bring you long-term focused analysis driven by fundamental data. Note that our analysis may not factor in the latest price-sensitive company announcements or qualitative material. Simply Wall St has no position in any stocks mentioned.