RLX Technology (RLX) Stock Could Be 40.1% Undervalued After Q1 Earnings
RLX Technology, Inc. Sponsored ADR RLX | 0.00 |
Fresh interest in RLX Technology (RLX) follows its fiscal Q1 2026 earnings, where international expansion and a focus on Europe and Asia, along with a balance sheet supporting share repurchases, have come into sharper focus for investors.
Despite the solid Q1 result and renewed focus on Europe and Asia, RLX Technology’s share price return is still down 18.97% year to date and 12.96% over 3 months. However, the 3 year total shareholder return of 13.36% suggests longer term holders have seen relatively better outcomes than more recent buyers.
If this earnings story has you thinking about where else growth and risk might be repriced, it could be worth scanning the market for other potential opportunities through the 20 top founder-led companies
With RLX Technology trading at US$1.88 and some analysts seeing room between this level and their targets, the key question is whether recent weakness leaves the stock mispriced or if the market is already reflecting expectations for future growth.
Most Popular Narrative: 40.1% Undervalued
Based on the most followed narrative, RLX Technology’s fair value of about $3.14 sits well above the last close at $1.88. This frames the recent weakness in a very different light.
The ongoing global shift from traditional cigarettes to reduced-risk products, such as e-vapor and oral nicotine, is growing the overall nicotine alternatives market; RLX's leadership and early move into multi-category offerings position it to capture expanding consumer demand, supporting strong long-term revenue growth.
Curious what sits behind that confidence in RLX Technology’s future growth profile, margin reset, and valuation multiple assumptions, including a higher required return baked into the 8.24% discount rate?
Result: Fair Value of $3.14 (UNDERVALUED)
However, the RLX Technology story still carries regulatory and competitive risks, with tighter e-vapor rules and aggressive global rivals both capable of pressuring margins and growth expectations.
Another View: RLX Technology Through A Cash Flow Lens
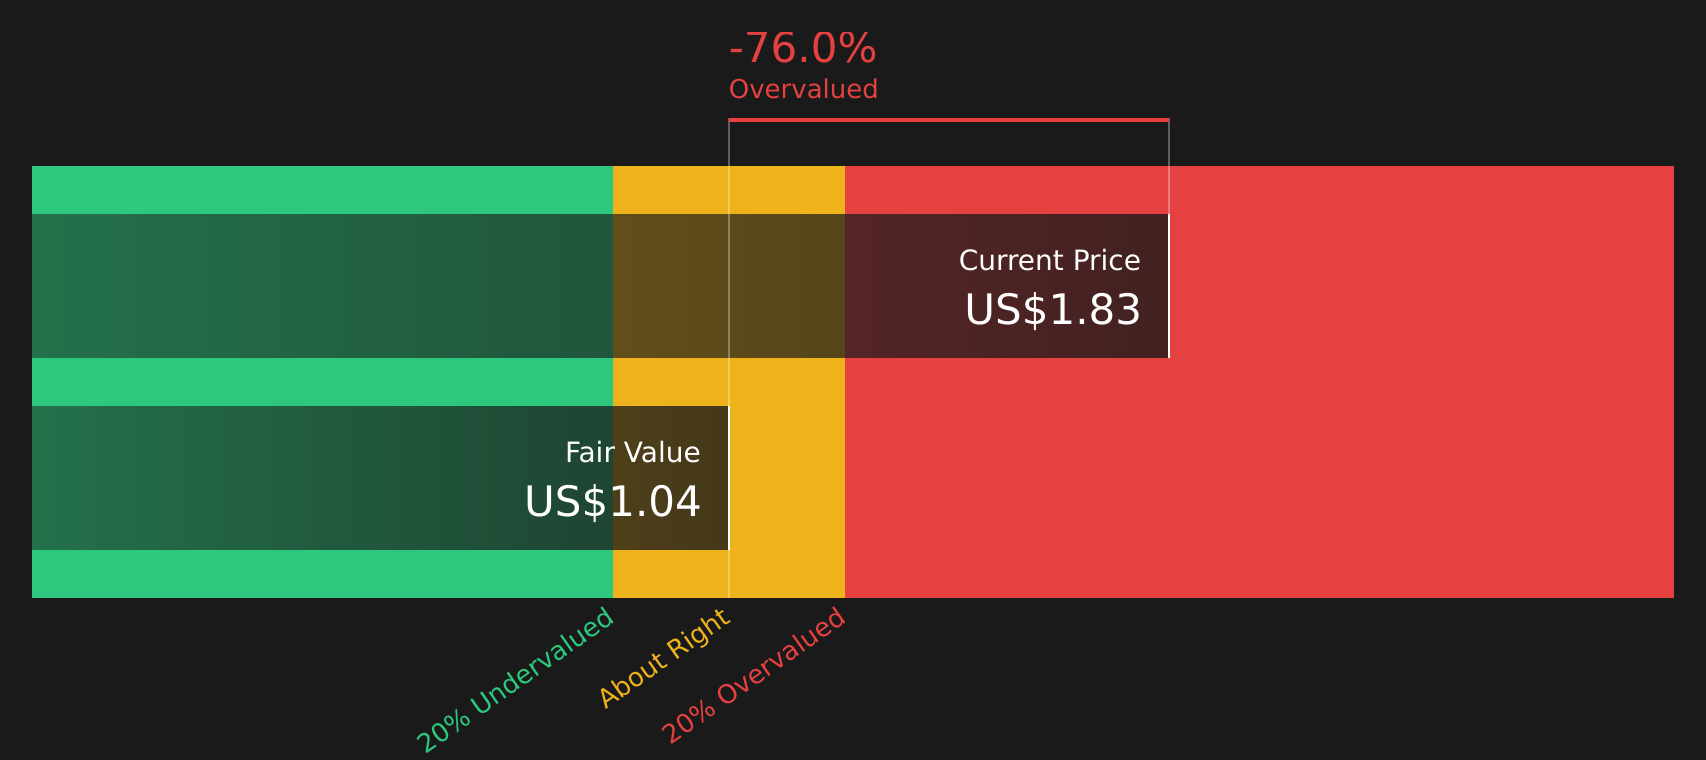
While the narrative fair value of $3.14 points to RLX Technology looking undervalued, the SWS DCF model tells a different story. On that approach, RLX at $1.88 is trading above an estimated future cash flow value of $1.04, which implies an overvalued signal instead. That split forces a simple question: which set of assumptions do you trust more?
Simply Wall St performs a discounted cash flow (DCF) on every stock in the world every day (check out RLX Technology for example). We show the entire calculation in full. You can track the result in your watchlist or portfolio and be alerted when this changes, or use our stock screener to discover 44 high quality undervalued stocks. If you save a screener we even alert you when new companies match - so you never miss a potential opportunity.
Next Steps
Given the mixed signals around RLX Technology, does the balance of risks and rewards line up with your own expectations, or is something being missed? If you want to weigh the regulatory concerns against the potential upside yourself, take a closer look at the 3 key rewards and 1 important warning sign.
Looking for more investment ideas beyond RLX Technology?
If RLX Technology has sharpened your thinking on pricing risk and potential, do not stop here. Use the Simply Wall St screener to surface fresh stock ideas.
- Target potential mispricings by scanning companies that combine quality fundamentals with attractive valuations through the 44 high quality undervalued stocks.
- Prioritize resilience by focusing on businesses that appear to manage risk well using the 66 resilient stocks with low risk scores.
- Spot underfollowed opportunities by reviewing the screener containing 19 high quality undiscovered gems before the wider market pays attention.
This article by Simply Wall St is general in nature. We provide commentary based on historical data and analyst forecasts only using an unbiased methodology and our articles are not intended to be financial advice. It does not constitute a recommendation to buy or sell any stock, and does not take account of your objectives, or your financial situation. We aim to bring you long-term focused analysis driven by fundamental data. Note that our analysis may not factor in the latest price-sensitive company announcements or qualitative material. Simply Wall St has no position in any stocks mentioned.