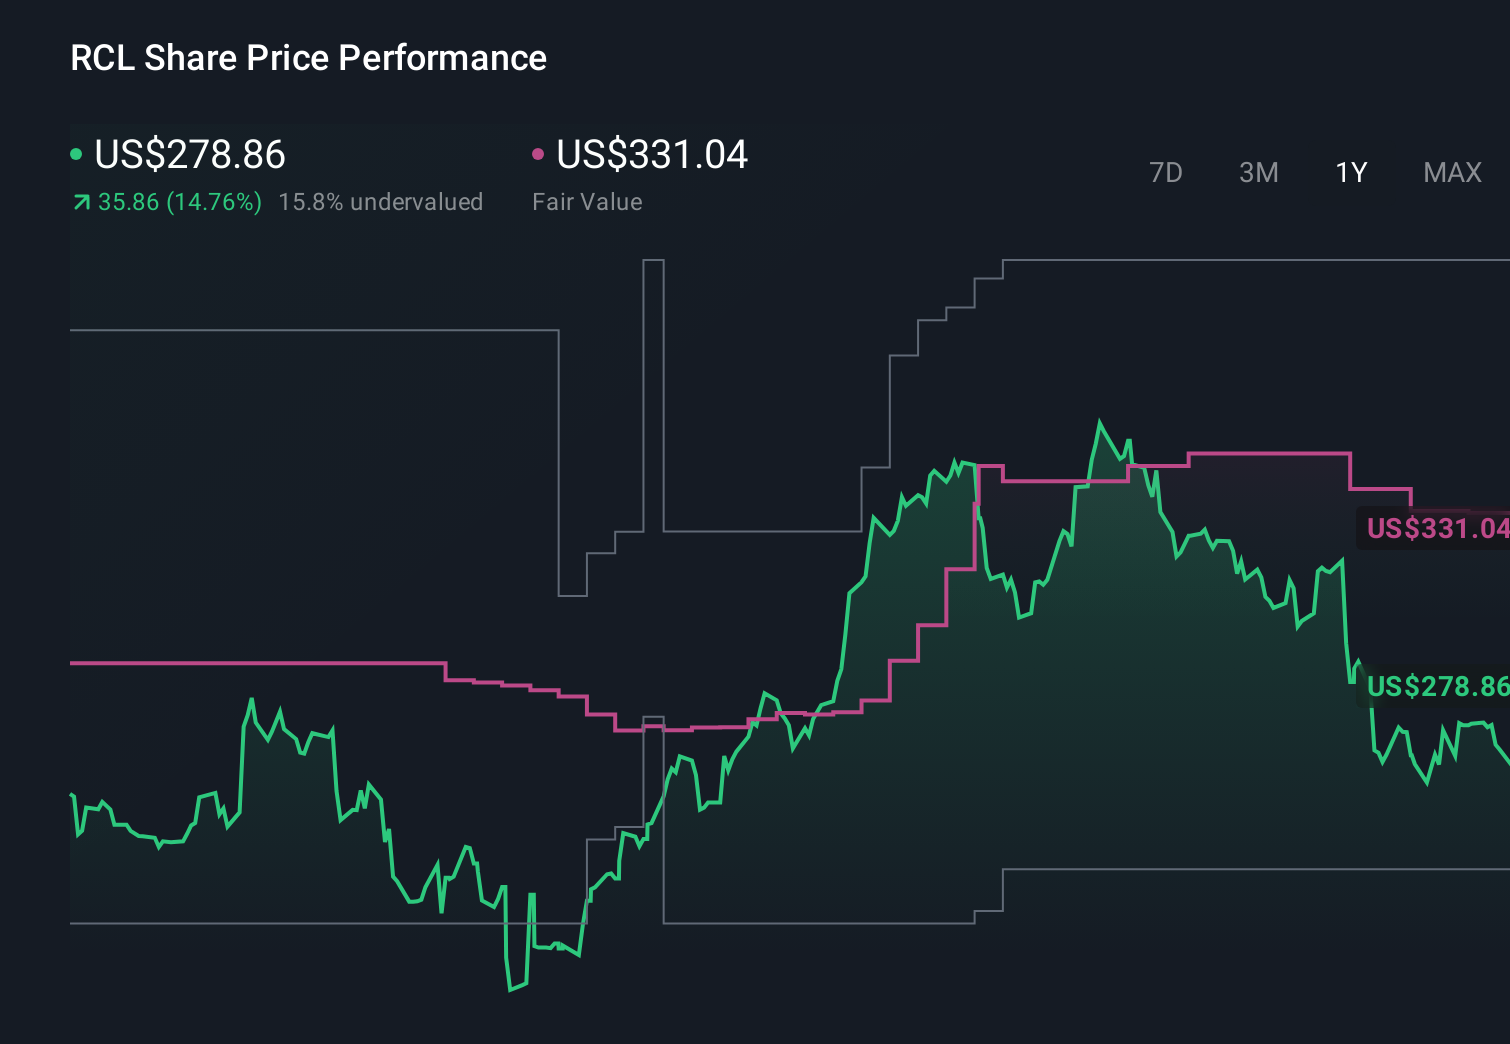
Royal Caribbean (RCL) Is Up 6.4% After Strong 2025 Results, Buyback, and New Ship Orders
Royal Caribbean Group RCL | 273.59 | -3.00% |
- In late January 2026, Royal Caribbean Cruises reported higher fourth-quarter and full-year 2025 revenue and earnings, confirmed double-digit revenue guidance for 2026, completed a US$200 million share buyback, and revealed new Discovery Class ship orders with Chantiers de l'Atlantique for deliveries starting in 2029.
- Together, the stronger profitability, planned fleet expansion, and management’s confidence in future demand signal a company positioning itself for a broader, multi-year vacation offering across ocean, river, and land experiences.
- We’ll now examine how Royal Caribbean’s upbeat 2026 guidance and emphasis on strong bookings could shape its investment narrative.
This technology could replace computers: discover 23 stocks that are working to make quantum computing a reality.
What Is Royal Caribbean Cruises' Investment Narrative?
For Royal Caribbean, the big-picture shareholder story is about believing its cruise-led vacation ecosystem can keep filling ships and destinations while servicing a sizable debt load. The latest earnings beat, improved margins, and confirmation of double-digit 2026 revenue guidance reinforce the near-term demand and pricing backdrop that had already been a key catalyst for the stock’s very large three-year total return. The new Discovery Class orders and multi-year expansion across ocean, river, and land look more like long-term capacity and brand investments than something that changes the next year or two of cash generation in a material way. What does shift the conversation now is capital allocation: a higher dividend, completed US$200 million buyback, and heavy future capex all raise the stakes if bookings or pricing soften from here.
However, the balance between ambitious fleet spending and high debt is something investors should watch closely.Royal Caribbean Cruises' shares have been on the rise but are still potentially undervalued. Find out how large the opportunity might be.Exploring Other Perspectives
Explore 10 other fair value estimates on Royal Caribbean Cruises - why the stock might be worth 36% less than the current price!
Build Your Own Royal Caribbean Cruises Narrative
Disagree with this assessment? Create your own narrative in under 3 minutes - extraordinary investment returns rarely come from following the herd.
- A great starting point for your Royal Caribbean Cruises research is our analysis highlighting 4 key rewards and 1 important warning sign that could impact your investment decision.
- Our free Royal Caribbean Cruises research report provides a comprehensive fundamental analysis summarized in a single visual - the Snowflake - making it easy to evaluate Royal Caribbean Cruises' overall financial health at a glance.
Contemplating Other Strategies?
Our top stock finds are flying under the radar-for now. Get in early:
- Uncover the next big thing with 26 elite penny stocks that balance risk and reward.
- Find 52 companies with promising cash flow potential yet trading below their fair value.
- Rare earth metals are the new gold rush. Find out which 31 stocks are leading the charge.
This article by Simply Wall St is general in nature. We provide commentary based on historical data and analyst forecasts only using an unbiased methodology and our articles are not intended to be financial advice. It does not constitute a recommendation to buy or sell any stock, and does not take account of your objectives, or your financial situation. We aim to bring you long-term focused analysis driven by fundamental data. Note that our analysis may not factor in the latest price-sensitive company announcements or qualitative material. Simply Wall St has no position in any stocks mentioned.