Royal Gold (RGLD) Valuation In Focus After Strong Earnings Beat And Cautious Analyst Outlook
Royal Gold, Inc. RGLD | 0.00 |
Q1 earnings beat meets cautious analyst sentiment
Royal Gold (RGLD) recently reported Q1 2026 earnings of $2.72 per share, an 80% year over year increase with record revenue growth. However, analysts have turned more cautious and now expect below average near term returns.
Royal Gold's share price has come under pressure recently, with declines of 6.4% over one day, 8.2% over seven days, 13.75% over 30 days and 26.89% over 90 days. At the same time, the 1 year total shareholder return of 18.16% and 3 year total shareholder return of 78.94% point to stronger longer term results. This suggests short term momentum is fading as the market reassesses growth expectations and risk after the Q1 earnings beat and cautious analyst tone.
If this earnings reaction has you rethinking your exposure to precious metals, it could be a good time to scan other producers through our 33 elite gold producer stocks
With Royal Gold shares under pressure despite an 80% jump in Q1 earnings per share to $2.72 and the stock trading at a discount to an average analyst price target of $326.25, are you looking at an opportunity or a market that is already pricing in future growth?
Most Popular Narrative: 36.8% Undervalued
Royal Gold's most followed narrative puts fair value at $326.25 per share compared with the last close at $206.07, framing a wide valuation gap that hinges on future growth, margins and Hod Maden restructuring outcomes.
The strategic acquisitions of Sandstorm Gold and Horizon Copper will significantly diversify Royal Gold's asset base, reducing single-asset risk and increasing exposure to long-term growth projects. This is expected to support more stable revenue streams and potentially improve net margins. Recent investments in projects like the Kansanshi gold stream (with a multi-decade production profile) and the Warintza copper-gold-moly project (large-scale development potential in the early 2030s) are framed as positioning Royal Gold to participate in demand for gold (as a hedge against inflation and geopolitical risk) and copper (linked to electrification and renewable energy adoption), which underpins assumptions of higher long-term revenue and earnings in this narrative.
This narrative raises questions about what kind of revenue curve and profit margins are incorporated into that fair value estimate and how much weight it assigns to Hod Maden relative to the rest of the portfolio, particularly in light of a higher required return and a richer future P/E used in the model.
Result: Fair Value of $326.25 (UNDERVALUED)
However, this hinges on gold remaining supportive and key mines avoiding further production setbacks, while higher deal competition or debt costs could quickly challenge those fair value assumptions.
Another View: Earnings Multiple Sends a Different Signal
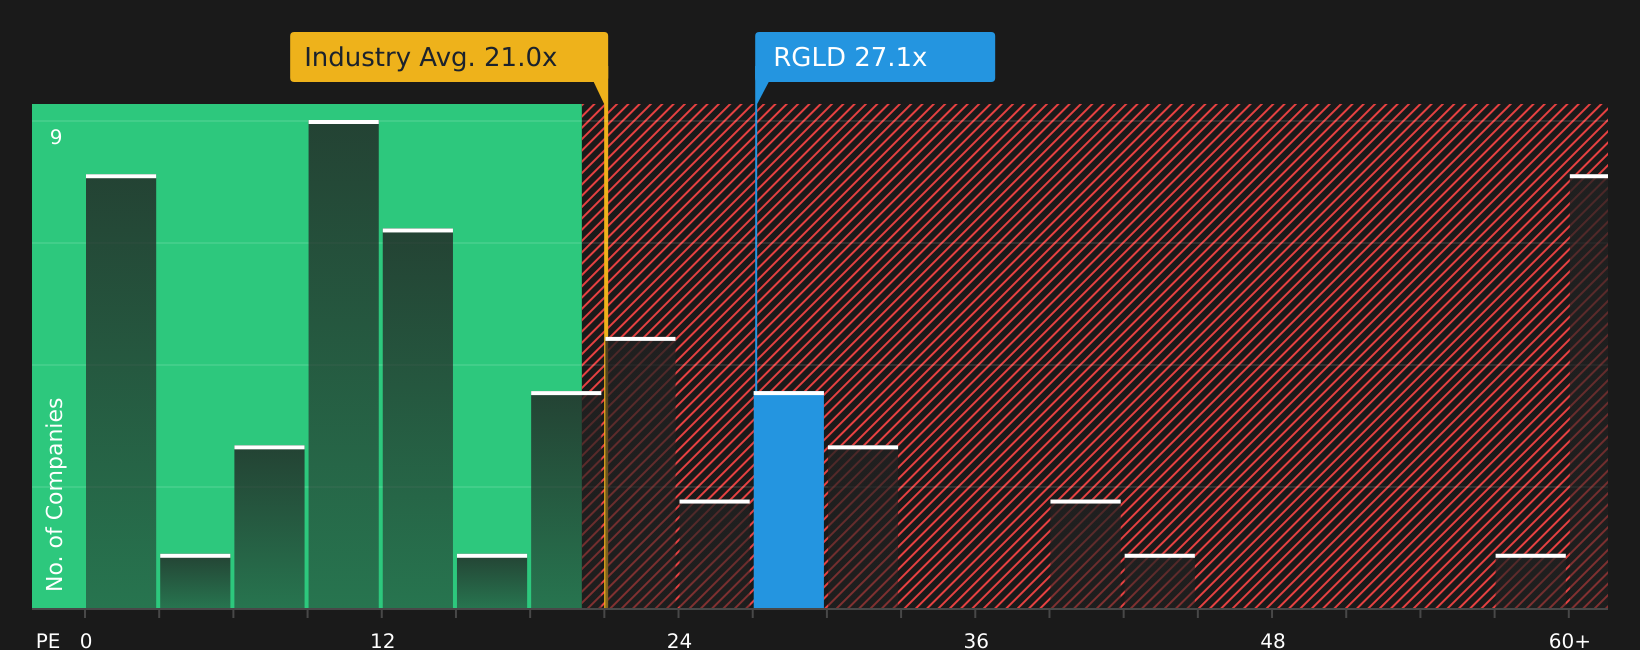
While the analyst narrative points to 36.8% upside to a fair value of $326.25, the current P/E of 27.6x tells a tougher story. It sits above the US Metals and Mining industry at 19.5x, above peers at 26.4x, and above a fair ratio of 24.4x. This implies less valuation cushion if sentiment weakens.
The gap between price and fair ratio might reflect confidence in Royal Gold's portfolio. It might also mean there is less room for error if growth or Hod Maden outcomes disappoint. Which explanation fits better with your own expectations for the business and the risks you are willing to take?
Next Steps
With sentiment divided between earnings strength and valuation questions, it makes sense to review the details yourself and decide quickly where you stand. A good place to start is the 4 key rewards and 2 important warning signs.
Looking for more investment ideas?
If Royal Gold has sharpened your thinking, do not stop here. Use focused stock lists to pressure test your next moves and avoid leaving opportunities on the table.
- Target potential bargains by scanning companies that combine quality fundamentals with lower valuations through the 49 high quality undervalued stocks.
- Reinforce your income stream by checking out stocks with resilient payout profiles using the 9 dividend fortresses.
- Prioritize resilience by reviewing companies with robust financial footing and clean balance sheets in the solid balance sheet and fundamentals stocks screener (46 results).
This article by Simply Wall St is general in nature. We provide commentary based on historical data and analyst forecasts only using an unbiased methodology and our articles are not intended to be financial advice. It does not constitute a recommendation to buy or sell any stock, and does not take account of your objectives, or your financial situation. We aim to bring you long-term focused analysis driven by fundamental data. Note that our analysis may not factor in the latest price-sensitive company announcements or qualitative material. Simply Wall St has no position in any stocks mentioned.