RTX (RTX) Stock Near Fair Value After Aerospace And Defense Sentiment Shift
RAYTHEON TECHNOLOGIES CORPORATION RTX | 0.00 |
Before getting into the details, here are the key things to know about RTX if you are asking whether the stock looks fairly priced or not right now.
- RTX often attracts investors who are asking a simple question: is the current share price offering good value for the risk they are taking on?
- At a recent close of US$186.59, the stock has returned 0.5% over the past week and 4.3% over the past month, with 1 year and 3 year returns of 32.9% and 103.3%, and a 5 year return of 141.6%.
- Recent news coverage around RTX has focused on its role in the aerospace and defense sector and how investor sentiment is responding to that positioning. This backdrop helps explain why some investors are reassessing both the upside potential and the risk profile at the current price.
- RTX currently has a value score of 3/6, which means it screens as undervalued on half of the six valuation checks used. The next sections will break down how different methods assess the stock and point to an even richer way of thinking about valuation by the end of the article.
Approach 1: RTX Discounted Cash Flow (DCF) Analysis
A Discounted Cash Flow, or DCF, model takes RTX free cash flow projections for future years and discounts them back to today to estimate what the whole company might be worth in present dollar terms.
RTX last reported trailing twelve month free cash flow of about $7.59b. Based on analyst inputs for the next several years and further extrapolations, Simply Wall St projects free cash flow reaching about $13.65b by 2030, using a 2 Stage Free Cash Flow to Equity model built on cash flow projections.
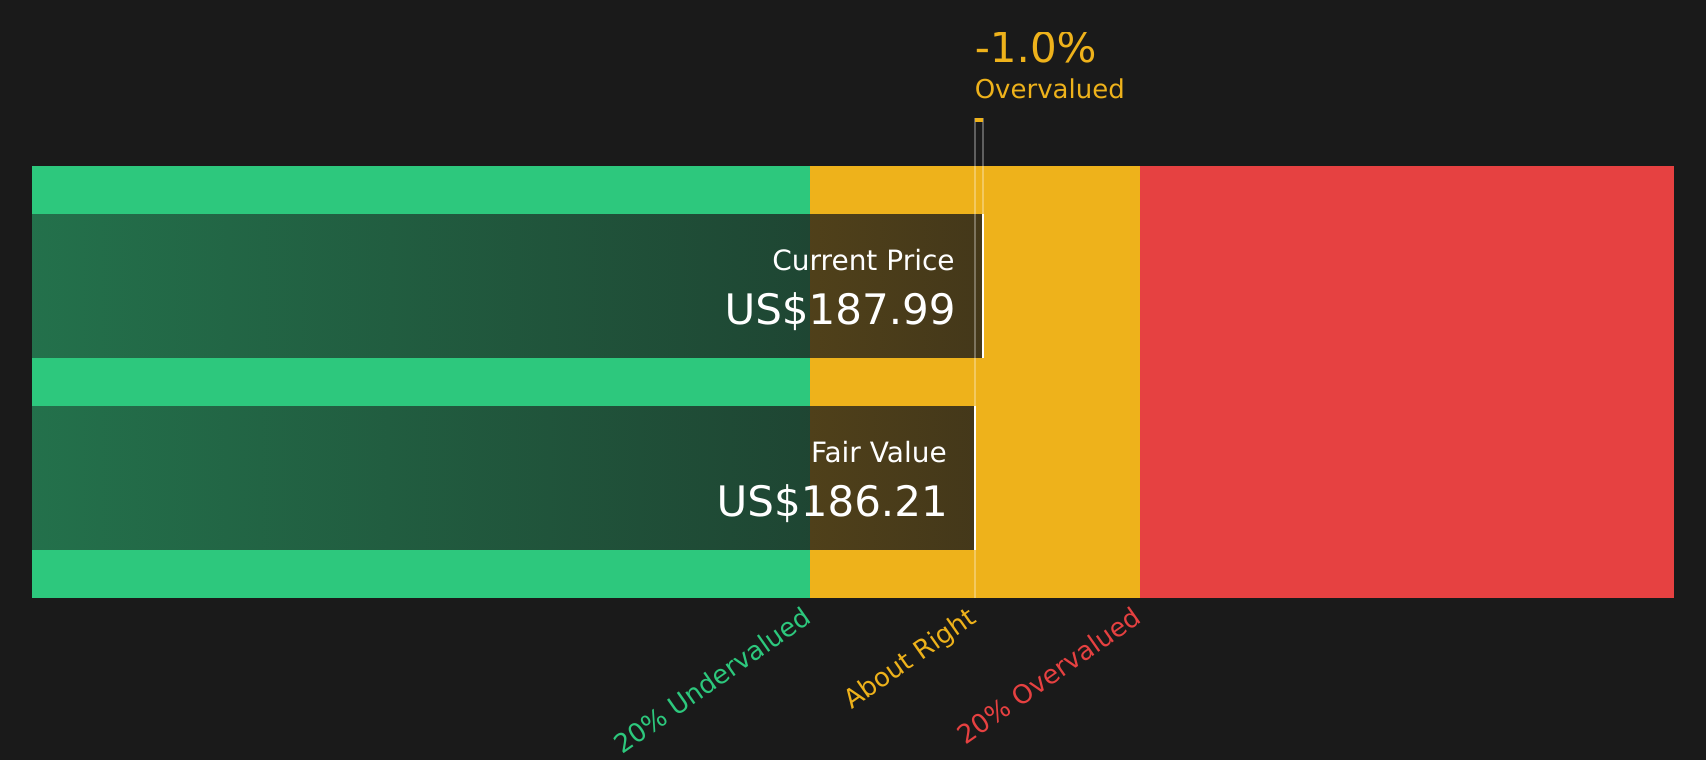
Adding up the discounted values of these cash flows and the terminal value produces an estimated intrinsic value of about $185.62 per share for RTX. Compared with the recent share price of $186.59, this model suggests the stock is roughly 0.5% above that estimate. This indicates RTX is trading very close to the DCF fair value band rather than offering a clear discount or premium.
Result: ABOUT RIGHT
RTX is fairly valued according to our Discounted Cash Flow (DCF), but this can change at a moment's notice. Track the value in your watchlist or portfolio and be alerted on when to act.
Approach 2: RTX Price vs Earnings
For a profitable company like RTX, the P/E ratio is a straightforward way to relate what you pay for each share to the earnings that support that price. Investors often look at P/E as a quick gauge of how the market is weighing the company against its current earnings power.
What counts as a "normal" or "fair" P/E typically reflects the balance between growth expectations and risk, with higher growth or lower perceived risk often lining up with a higher justified multiple, and the reverse also being true. RTX currently trades on a P/E of 34.63x, compared with an Aerospace & Defense industry average of about 38.86x and a peer group average of 55.42x.
Simply Wall St also provides a Fair Ratio of 35.42x for RTX, which is an estimate of the P/E that might be appropriate after considering factors such as earnings growth characteristics, profit margins, industry, market cap and risk profile. This Fair Ratio is designed to be more tailored than a simple comparison with industry and peers, since those benchmarks can mix companies with very different fundamentals. With RTX actual P/E only slightly below the Fair Ratio, the stock screens as broadly in line with that proprietary estimate.
Result: ABOUT RIGHT

P/E ratios tell one story, but what if the real opportunity lies elsewhere? Start investing in legacies, not executives. Discover our 20 top founder-led companies.
Upgrade Your Decision Making: Choose your RTX Narrative
Earlier it was mentioned that there is an even better way to understand valuation. Narratives on Simply Wall St let you attach a clear story to the RTX numbers by linking your assumptions about future revenue, earnings and margins to a financial forecast and a fair value. You can then compare that fair value to the current share price to help you decide whether RTX looks attractive, fully priced or expensive on your terms. Each Narrative lives on the Community page and updates automatically when new news or earnings arrive. Narratives can also differ widely, for example between an optimistic view that RTX could be worth closer to US$242 and a more cautious view nearer to US$180. This helps you see how your own perspective sits on that spectrum.
Do you think there's more to the story for RTX? Head over to our Community to see what others are saying!

This article by Simply Wall St is general in nature. We provide commentary based on historical data and analyst forecasts only using an unbiased methodology and our articles are not intended to be financial advice. It does not constitute a recommendation to buy or sell any stock, and does not take account of your objectives, or your financial situation. We aim to bring you long-term focused analysis driven by fundamental data. Note that our analysis may not factor in the latest price-sensitive company announcements or qualitative material. Simply Wall St has no position in any stocks mentioned.