

RXO (RXO) Is Up 27.6% After Multi-Day Rally Highlights Freight Tech Investor Interest
RXO, Inc. Common Stock RXO | 0.00 |
- In the past week, RXO’s shares extended a multi-day winning streak that lifted its market capitalization by about US$1.20 billion to roughly US$4.10 billion, reflecting heightened interest in its freight forwarding and supply chain technology business.
- This strong run has occurred even as several major banks maintained Hold ratings, suggesting a gap between cautious analyst views and recent investor enthusiasm.
- With RXO’s recent momentum and rising market value as a backdrop, we’ll examine how this upswing may influence its existing investment narrative.
Capitalize on the AI infrastructure supercycle with our selection of the 46 best 'picks and shovels' of the AI gold rush converting record-breaking demand into massive cash flow.
RXO Investment Narrative Recap
To own RXO, you need to believe its technology driven brokerage and newer services like middle mile can eventually translate into sustainable profits despite current losses and freight softness. The recent 39% six day rally and US$1.20 billion jump in market value highlight how quickly sentiment can swing, but they do not materially change the near term dependence on a freight recovery or the key risk around ongoing exposure to weak automotive demand and industry wide pricing pressure.
RXO’s Q1 2026 results showed sales of US$1,425 million and a net loss of US$36 million, reinforcing that the business is still in investment and normalization mode even as the share price has sprinted ahead. Against that backdrop, product moves like the launch of Middle Mile Solutions look important, because bundling first, middle, and last mile through RXO Connect ties directly into the core catalyst of using technology and integrated services to deepen shipper relationships and improve margin potential over time.
Yet while the recent surge in RXO’s share price grabs attention, investors should also be aware that rising labor and compliance costs could...
RXO's narrative projects $6.6 billion revenue and $86.7 million earnings by 2029. This requires 4.9% yearly revenue growth and a $186.7 million earnings increase from -$100.0 million today.
Uncover how RXO's forecasts yield a $15.85 fair value, a 35% downside to its current price.
Exploring Other Perspectives
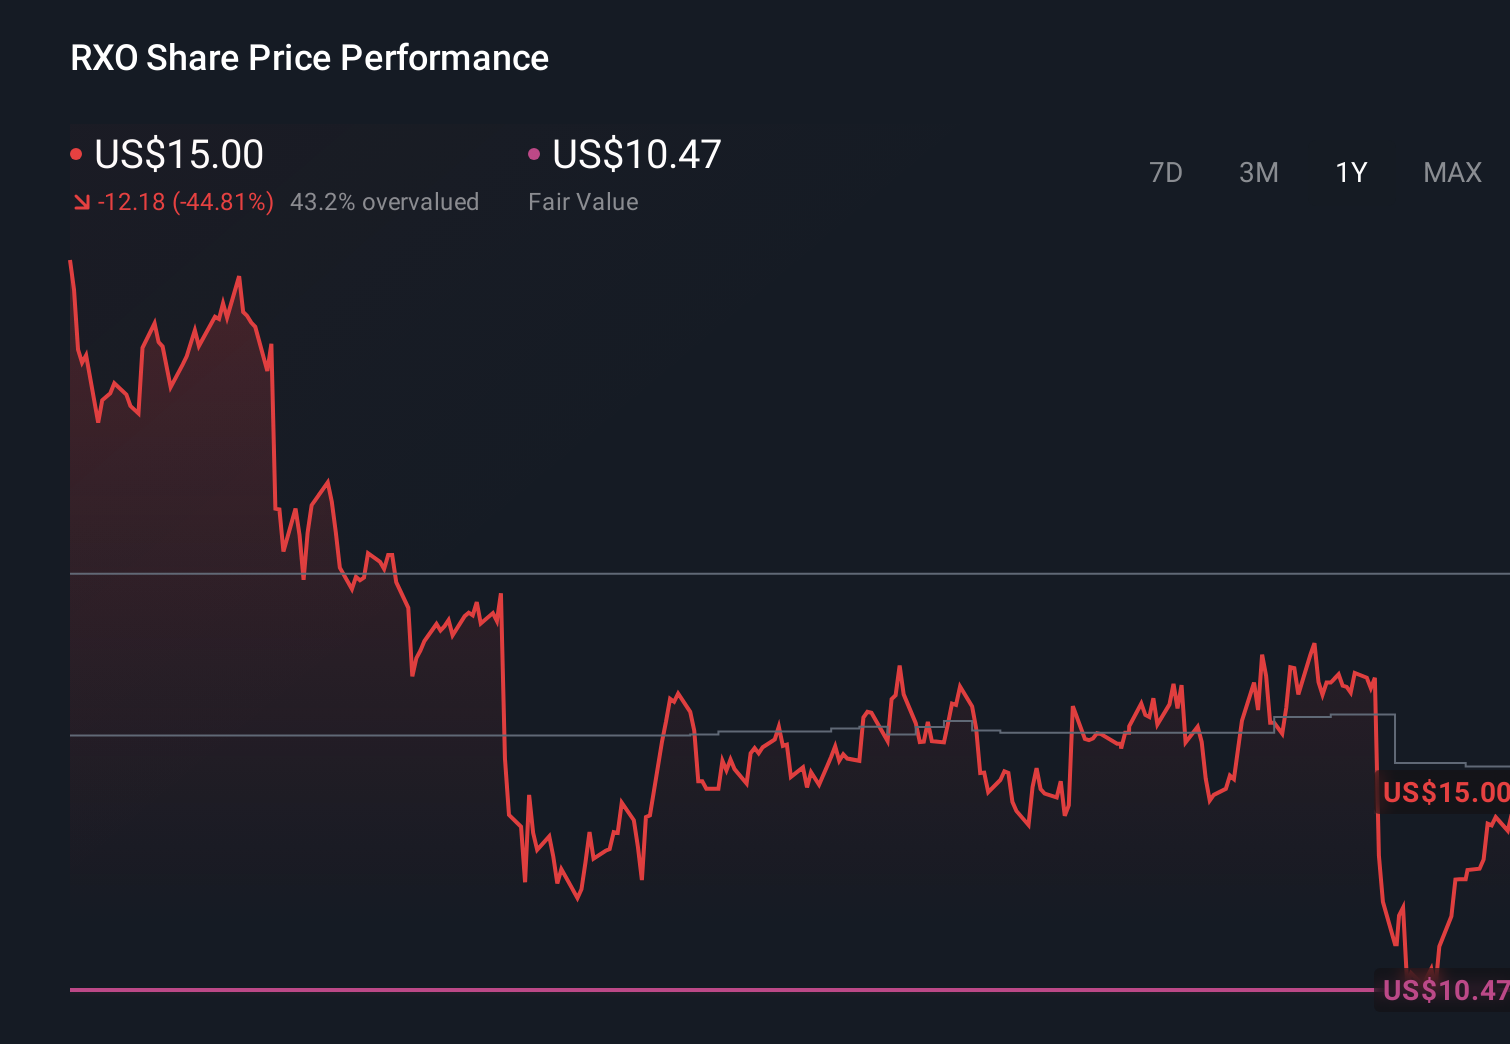
Some of the most pessimistic analysts were assuming RXO’s revenue might grow only about 4 percent annually to roughly US$6.5 billion by 2029, with earnings barely positive at about US$22.5 million, which is a very different story from the recent 39 percent share price jump and underlines how widely views can differ and why it is worth weighing several possible futures.
Explore 3 other fair value estimates on RXO - why the stock might be worth 35% less than the current price!
The Verdict Is Yours
Don't just follow the ticker - dig into the data and build a conviction that's truly your own.
- A great starting point for your RXO research is our analysis highlighting 3 key rewards and 1 important warning sign that could impact your investment decision.
- Our free RXO research report provides a comprehensive fundamental analysis summarized in a single visual - the Snowflake - making it easy to evaluate RXO's overall financial health at a glance.
Ready To Venture Into Other Investment Styles?
Every day counts. These free picks are already gaining attention. See them before the crowd does:
- Uncover the next big thing with 25 elite penny stocks that balance risk and reward.
- AI is about to change healthcare. These 34 stocks are working on everything from early diagnostics to drug discovery. The best part - they are all under $10b in market cap - there's still time to get in early.
- Explore 28 top quantum computing companies leading the revolution in next-gen technology and shaping the future with breakthroughs in quantum algorithms, superconducting qubits, and cutting-edge research.
This article by Simply Wall St is general in nature. We provide commentary based on historical data and analyst forecasts only using an unbiased methodology and our articles are not intended to be financial advice. It does not constitute a recommendation to buy or sell any stock, and does not take account of your objectives, or your financial situation. We aim to bring you long-term focused analysis driven by fundamental data. Note that our analysis may not factor in the latest price-sensitive company announcements or qualitative material. Simply Wall St has no position in any stocks mentioned.