Should CME’s Shifting FedWatch Signals and New Futures Offerings Require Action From CME Group (CME) Investors?
CME Group Inc. Class A CME | 305.11 | +2.75% |
- Earlier in March 2026, CME Group filed a US$466.79 million shelf registration for 1,500,000 Class A shares tied to an ESOP-related offering, while Tickblaze announced a new partnership to deliver CME futures market data directly within its trading platform and CME recorded initial block trades in newly launched South Asia edible oil futures.
- At the same time, CME’s Fed-related market data revealed a sharp shift in trader expectations toward potential interest rate hikes, pulling attention to how its core interest rate derivatives franchise reflects and channels changing macro sentiment.
- We’ll now examine how this shift in Fed rate expectations, captured through CME’s own data, may influence its existing investment narrative.
We've uncovered the 13 dividend fortresses yielding 5%+ that don't just survive market storms, but thrive in them.
CME Group Investment Narrative Recap
To own CME Group, you generally need to believe in durable global demand for transparent, centrally cleared derivatives and data tied to macro and interest rate risk. The recent shift in Fed hike probabilities, seen through CME’s own data, mainly reinforces how central its interest rate complex is to sentiment; the ESOP shelf filing, Tickblaze data partnership, and new South Asia edible oil futures do not materially change the near term focus on rate driven volatility as both a key catalyst and a concentration risk.
The Tickblaze integration stands out here because it directly links more traders to CME’s futures market data at a moment when Fed expectations are moving quickly, keeping attention on data and rate products as core volume drivers. While the South Asia edible oil futures launch broadens the agricultural franchise, it is this type of data distribution agreement that most closely connects current macro uncertainty to CME’s existing narrative around interest rate and equity derivatives concentration.
Yet investors should also weigh how CME’s heavy reliance on interest rate and equity futures could become a vulnerability if...
CME Group's narrative projects $7.3 billion revenue and $4.3 billion earnings by 2028. This requires 4.4% yearly revenue growth and a roughly $0.6 billion earnings increase from $3.7 billion today.
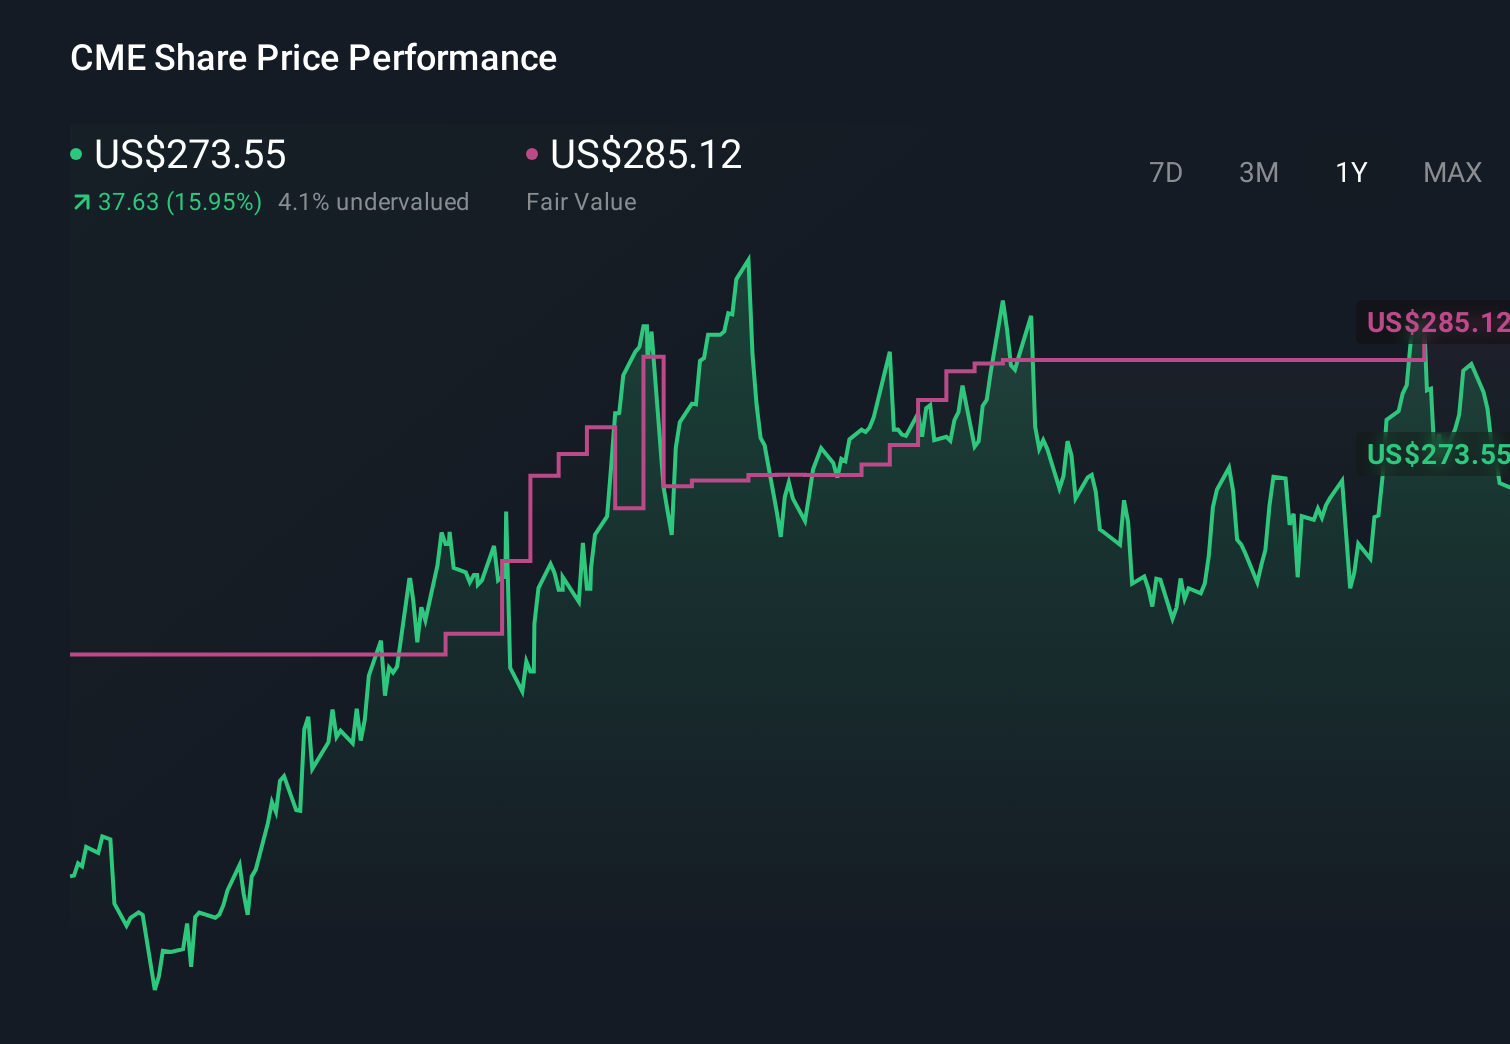
Uncover how CME Group's forecasts yield a $305.21 fair value, in line with its current price.
Exploring Other Perspectives
Three Simply Wall St Community members currently place CME’s fair value between US$244.70 and US$305.21, underlining how far individual opinions can diverge. Set against that spread, CME’s dependence on interest rate and equity futures volumes means any extended drop in volatility could affect the business in ways different investors may be valuing very differently, so it is worth examining several of these viewpoints before deciding how you see the stock.
Explore 3 other fair value estimates on CME Group - why the stock might be worth as much as $305.21!
Form Your Own Verdict
Don't just follow the ticker - dig into the data and build a conviction that's truly your own.
- A great starting point for your CME Group research is our analysis highlighting 3 key rewards and 2 important warning signs that could impact your investment decision.
- Our free CME Group research report provides a comprehensive fundamental analysis summarized in a single visual - the Snowflake - making it easy to evaluate CME Group's overall financial health at a glance.
Ready To Venture Into Other Investment Styles?
Right now could be the best entry point. These picks are fresh from our daily scans. Don't delay:
- Uncover the next big thing with 32 elite penny stocks that balance risk and reward.
- This technology could replace computers: discover 24 stocks that are working to make quantum computing a reality.
- Find 54 companies with promising cash flow potential yet trading below their fair value.
This article by Simply Wall St is general in nature. We provide commentary based on historical data and analyst forecasts only using an unbiased methodology and our articles are not intended to be financial advice. It does not constitute a recommendation to buy or sell any stock, and does not take account of your objectives, or your financial situation. We aim to bring you long-term focused analysis driven by fundamental data. Note that our analysis may not factor in the latest price-sensitive company announcements or qualitative material. Simply Wall St has no position in any stocks mentioned.