Should TransUnion’s (TRU) Confident 2026 Outlook and Capital Returns Require Action From Investors?
TransUnion TRU | 75.64 75.64 | +1.11% 0.00% Post |
- In February 2026, TransUnion reported past fourth-quarter 2025 results showing higher sales and earnings, issued 2026 guidance calling for mid‑single‑digit to high‑single‑digit revenue and earnings growth, raised its quarterly cash dividend to US$0.125 per share, and completed a US$300.89 million share repurchase program.
- The combination of stronger recent performance, upbeat forward guidance, a higher dividend, and completed buybacks underlines management’s confidence in cash generation and business resilience.
- Now we’ll examine how TransUnion’s upbeat 2026 revenue and earnings guidance could influence the existing investment narrative around its transformation.
Find 55 companies with promising cash flow potential yet trading below their fair value.
TransUnion Investment Narrative Recap
To own TransUnion, you need to be comfortable with a data and analytics business that is still reshaping its technology, while facing regulatory and competitive pressures. The latest results and 2026 outlook support the near term catalyst around the OneTru and AI rollout, but the biggest risk remains regulatory and data privacy change that could affect how TransUnion uses its data. This week’s news does not materially change that risk, but it does sharpen the focus on execution.
The most relevant update is TransUnion’s 2026 guidance, calling for 8% to 9% reported revenue growth and 18% to 21% net income growth for the year. That outlook sits alongside ongoing investment in cloud platforms and analytics, so it matters for investors watching whether the technology transformation can translate into sustained earnings growth without eroding margins or weakening the balance sheet.
Yet against this constructive outlook, investors should still be watching closely for how quickly new privacy rules or data sharing limits could start to affect...
TransUnion’s narrative projects $5.6 billion revenue and $869.9 million earnings by 2028. This requires 8.4% yearly revenue growth and about a $478 million earnings increase from $392.0 million today.
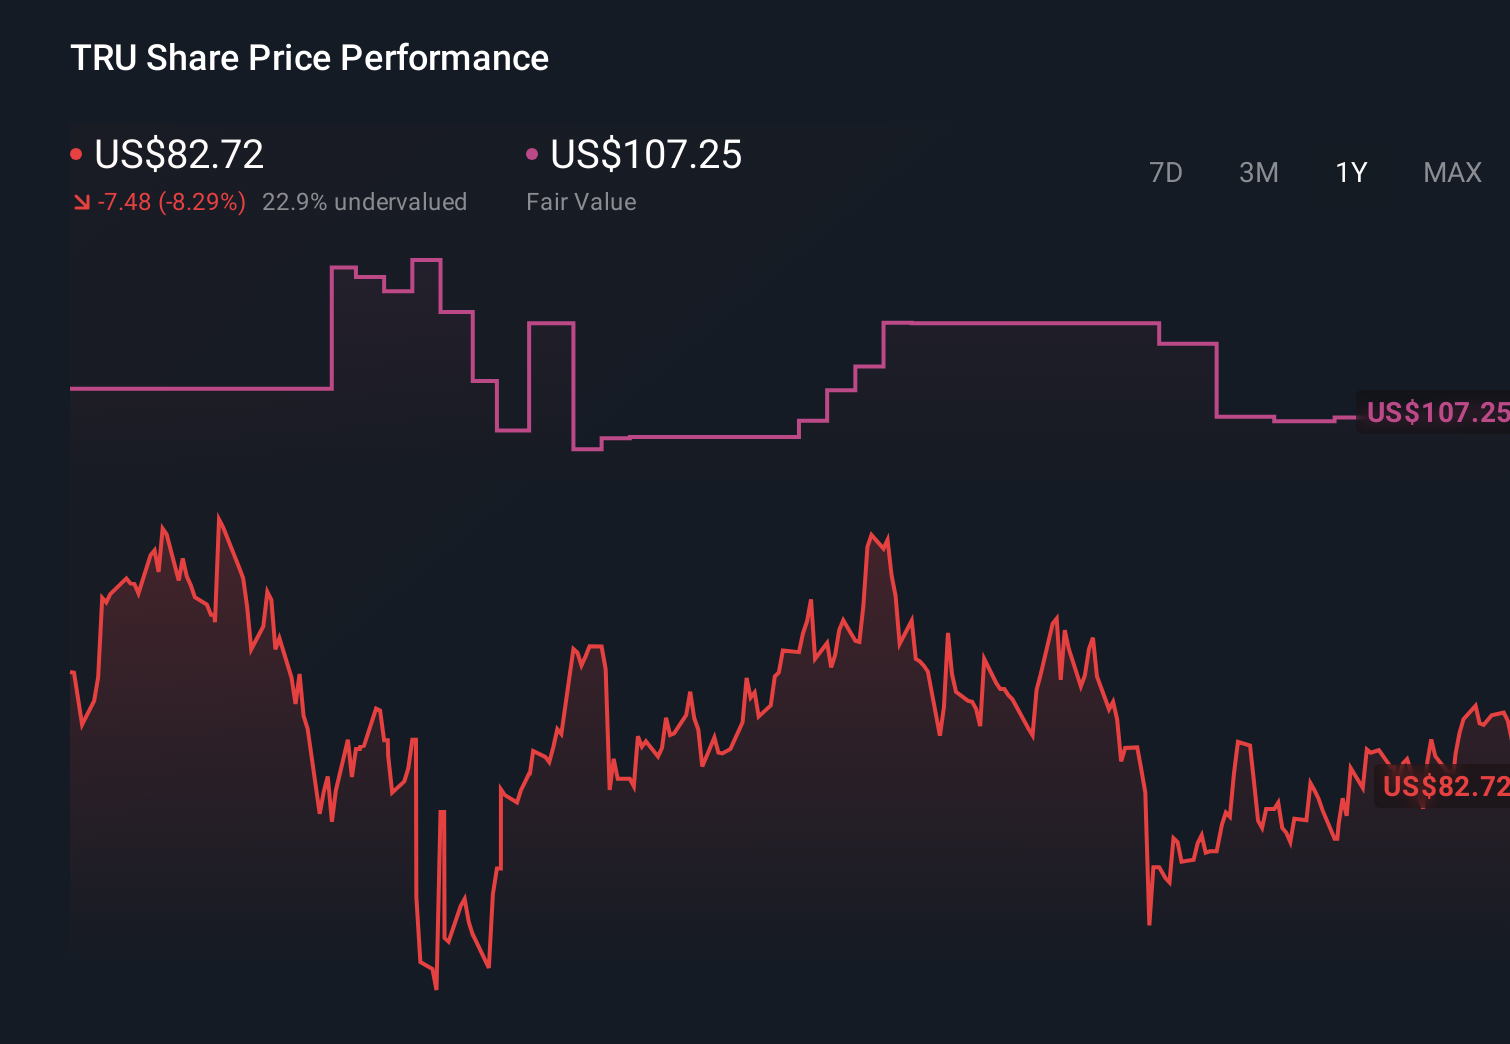
Uncover how TransUnion's forecasts yield a $105.25 fair value, a 42% upside to its current price.
Exploring Other Perspectives
The lowest set of analysts was already cautious, assuming only about 7% annual revenue growth and US$742.7 million in earnings by 2029, so this new guidance could either ease those concerns or reinforce them depending on how you view the risks around AI adoption and data regulation.
Explore 2 other fair value estimates on TransUnion - why the stock might be worth just $105.25!
The Verdict Is Yours
Disagree with existing narratives? Extraordinary investment returns rarely come from following the herd, so go with your instincts.
- A great starting point for your TransUnion research is our analysis highlighting 4 key rewards and 1 important warning sign that could impact your investment decision.
- Our free TransUnion research report provides a comprehensive fundamental analysis summarized in a single visual - the Snowflake - making it easy to evaluate TransUnion's overall financial health at a glance.
Looking For Alternative Opportunities?
Every day counts. These free picks are already gaining attention. See them before the crowd does:
- We've uncovered the 13 dividend fortresses yielding 5%+ that don't just survive market storms, but thrive in them.
- Capitalize on the AI infrastructure supercycle with our selection of the 34 best 'picks and shovels' of the AI gold rush converting record-breaking demand into massive cash flow.
- Rare earth metals are an input to most high-tech devices, military and defence systems and electric vehicles. The global race is on to secure supply of these critical minerals. Beat the pack to uncover the 30 best rare earth metal stocks of the very few that mine this essential strategic resource.
This article by Simply Wall St is general in nature. We provide commentary based on historical data and analyst forecasts only using an unbiased methodology and our articles are not intended to be financial advice. It does not constitute a recommendation to buy or sell any stock, and does not take account of your objectives, or your financial situation. We aim to bring you long-term focused analysis driven by fundamental data. Note that our analysis may not factor in the latest price-sensitive company announcements or qualitative material. Simply Wall St has no position in any stocks mentioned.