Simon Property Group (SPG) Could Be 23% Undervalued On Downgrade And Russell Index Shift
Simon Property Group, Inc. SPG | 0.00 |
Simon Property Group (SPG) is drawing attention after Wolfe Research cut its rating to Peer Perform and the stock was shifted among several Russell indexes, including additions to growth defensive groupings.
The Wolfe Research downgrade came after a strong run for Simon Property Group, with a 30 day share price return of 9.15% and a year to date share price return of 21.57%. The 1 year total shareholder return of 42.62% and 3 year total shareholder return of about 12x indicate that momentum has been strong rather than fading, even as the stock now sits at US$223.65 and shifts into Russell growth defensive indexes.
If you are weighing what other income and defensively tilted opportunities might look like alongside Simon Property Group, it could be a good time to scan 10 dividend fortresses
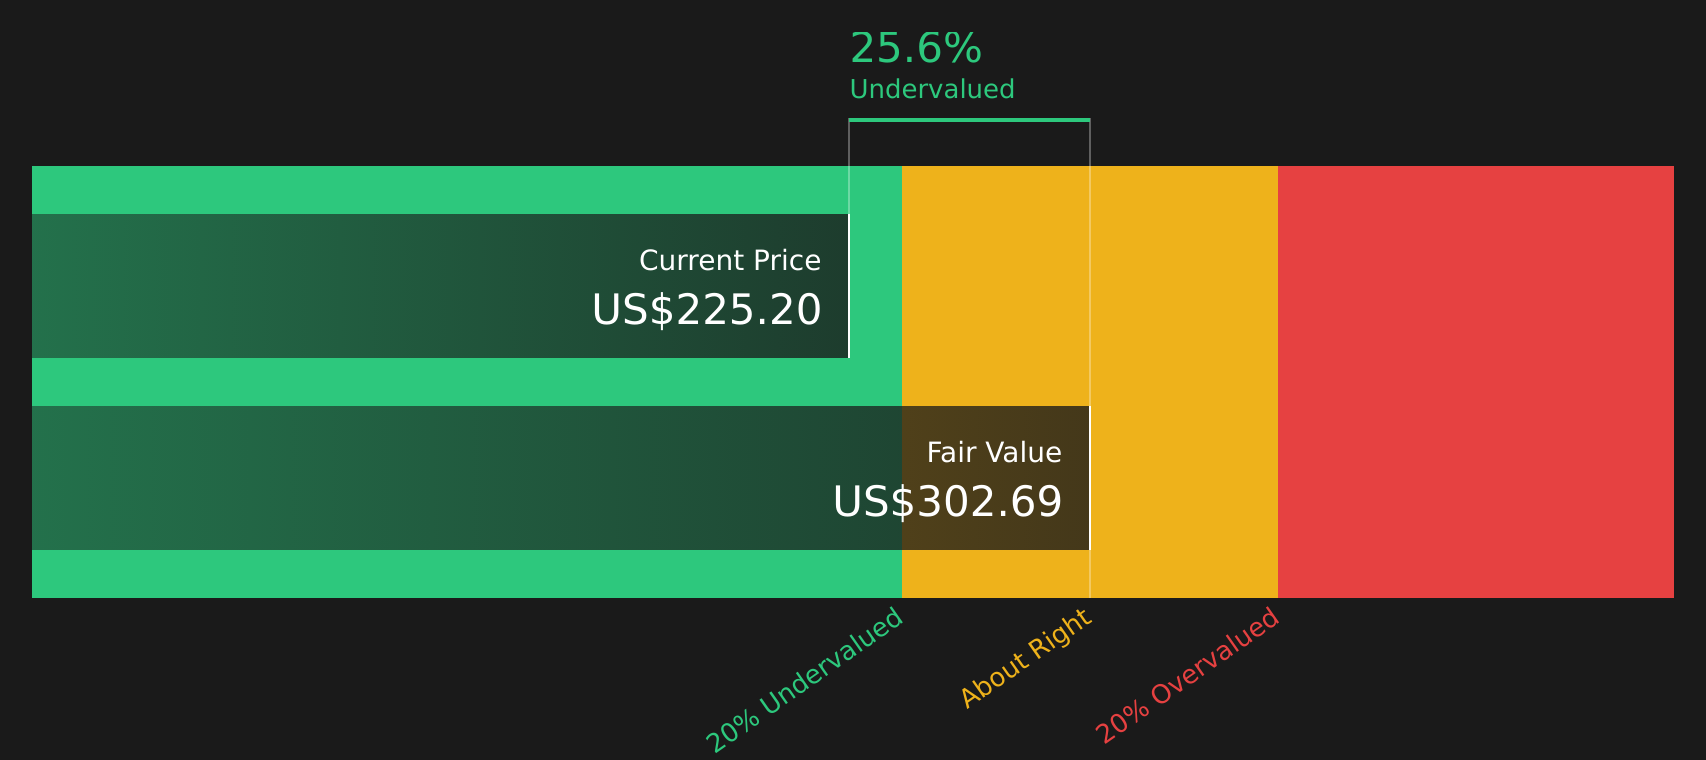
With Simon Property Group now sitting near US$223.65, carrying an intrinsic discount estimate of about 23% yet trading just above the average analyst price target, you have to ask: is there still a buying opportunity here or is the market already pricing in future growth?
Price-to-Earnings of 15.5x: Is it justified?
On a simple snapshot, Simon Property Group looks inexpensive relative to peers, with a P/E of 15.5x against the US Retail REITs average of 27x and a peer average of 32.4x.
The P/E ratio compares the current share price to earnings per share and is a common way investors weigh what they are paying for each dollar of profit. For a mature, income focused REIT like Simon Property Group, it is often used as a quick check on how the market is treating its earnings power.
Here the gap is wide. The stock trades on a lower P/E than both its industry and peer averages, and also below an estimated fair P/E of 24.1x. That indicates the current multiple is below a level the market might consider if sentiment or expectations around earnings changed. This is particularly notable given reported earnings growth of 128.8% over the past year and 15.2% per year over the past 5 years.
Against the broader US Retail REITs industry, the discount appears even clearer, with Simon Property Group’s 15.5x P/E sitting well under the 27x industry average. For investors comparing income focused real estate stocks, that is a material valuation gap to keep in mind alongside other factors such as debt, cash flow coverage and earnings quality.
Result: Price-to-Earnings of 15.5x (UNDERVALUED)
However, Simon Property Group’s annual net income trend and its concentration in retail focused real estate could both challenge the current valuation story if conditions weaken.
Another view on Simon Property Group’s value
Alongside the P/E comparison, our DCF model values Simon Property Group at about $289.40 per share, compared with the current $223.65 price. That indicates the stock is trading at a sizeable discount, so the question is whether the cash flow assumptions will hold up.
Simply Wall St performs a discounted cash flow (DCF) on every stock in the world every day (check out Simon Property Group for example). We show the entire calculation in full. You can track the result in your watchlist or portfolio and be alerted when this changes, or use our stock screener to discover 43 high quality undervalued stocks. If you save a screener we even alert you when new companies match - so you never miss a potential opportunity.
Next Steps
Given the mix of optimism and caution around Simon Property Group, now is a good time to review the data yourself, weigh the trade offs, and see the 3 key rewards and 4 important warning signs
Looking for more investment ideas beyond Simon Property Group?
If Simon Property Group has your attention, do not stop there. Broaden your watchlist now so you are not relying on a single income story.
- Target potential mispricing by checking stocks that appear overlooked on quality and valuation, starting with the screener containing 19 high quality undiscovered gems.
- Strengthen the defensive side of your portfolio by scanning companies with solid balance sheet and fundamentals stocks screener (48 results) before the market catches on.
- Lock in a shortlist of income candidates by reviewing 10 dividend fortresses while yields and fundamentals still line up.
This article by Simply Wall St is general in nature. We provide commentary based on historical data and analyst forecasts only using an unbiased methodology and our articles are not intended to be financial advice. It does not constitute a recommendation to buy or sell any stock, and does not take account of your objectives, or your financial situation. We aim to bring you long-term focused analysis driven by fundamental data. Note that our analysis may not factor in the latest price-sensitive company announcements or qualitative material. Simply Wall St has no position in any stocks mentioned.