

SK hynix (NasdaqGS:SKHY) Cross Lists On Nasdaq, Is The Stock Still Cheap?
SK hynix Inc. Sponsored ADR SKHY | 0.00 |
SK hynix cross listing puts fresh focus on stock
SK hynix (NasdaqGS:SKHY) has drawn fresh investor attention after cross listing on the Nasdaq and raising US$26.5b, the largest foreign company listing in US markets to date.
The fresh Nasdaq listing has coincided with strong short term momentum in SK hynix, with a 7 day share price return of 26.68% and a 30 day share price return of 11.26% at a latest share price of US$171.38. The year to date share price return of 2.01% shows a more modest longer term move.
If this kind of activity has your attention, it can be useful to look at other chip related opportunities using a focused screener such as 56 AI infrastructure stocks.
Bulls see SK hynix as a key memory supplier for AI infrastructure, while bears worry the Nasdaq surge and US$26.5b raise leave the stock overheated. Which case does the current valuation support?
Preferred P/E of 7.4x for SK hynix: Is it justified?
On simple numbers, SK hynix trades on a P/E of 7.4x while the US Semiconductor industry average sits at 53.6x and the peer group average at 62x. That big gap points to a stock the market is pricing far below many comparable semiconductor companies on earnings.
The P/E ratio compares the current share price to earnings per share. For a company like SK hynix that earns most of its revenue from manufacturing and selling memory and storage semiconductors, it is a quick way to see how much investors are paying today for each dollar of current earnings.
Here, SK hynix is described as good value on P/E versus both the broader US Semiconductor industry and its direct peers. That means the market is assigning a much lower earnings multiple compared with similar businesses. It raises the question of whether investors are underpricing that earnings profile or whether they are building in a margin of safety around factors that are not captured by the headline multiple.
The comparison is stark. The industry average P/E of 53.6x and peer average of 62x both sit many times above SK hynix at 7.4x. This is strong comparative language in valuation terms and frames SK hynix as priced at a steep earnings discount relative to similar semiconductor stocks based on the available data.
Result: Price-to-earnings of 7.4x (UNDERVALUED)
However, the SK hynix story also carries risks, including potential volatility around such a large US$26.5b raise and shifts in demand for memory and storage chips.
Another view on SK hynix using cash flows
The low 7.4x P/E paints SK hynix as cheap, and our DCF model points in the same direction as well. At a share price of $171.38, SK hynix is described as trading about 70.1% below an estimated $573.18 future cash flow value. If both earnings and cash flows indicate value, what might the market be discounting?
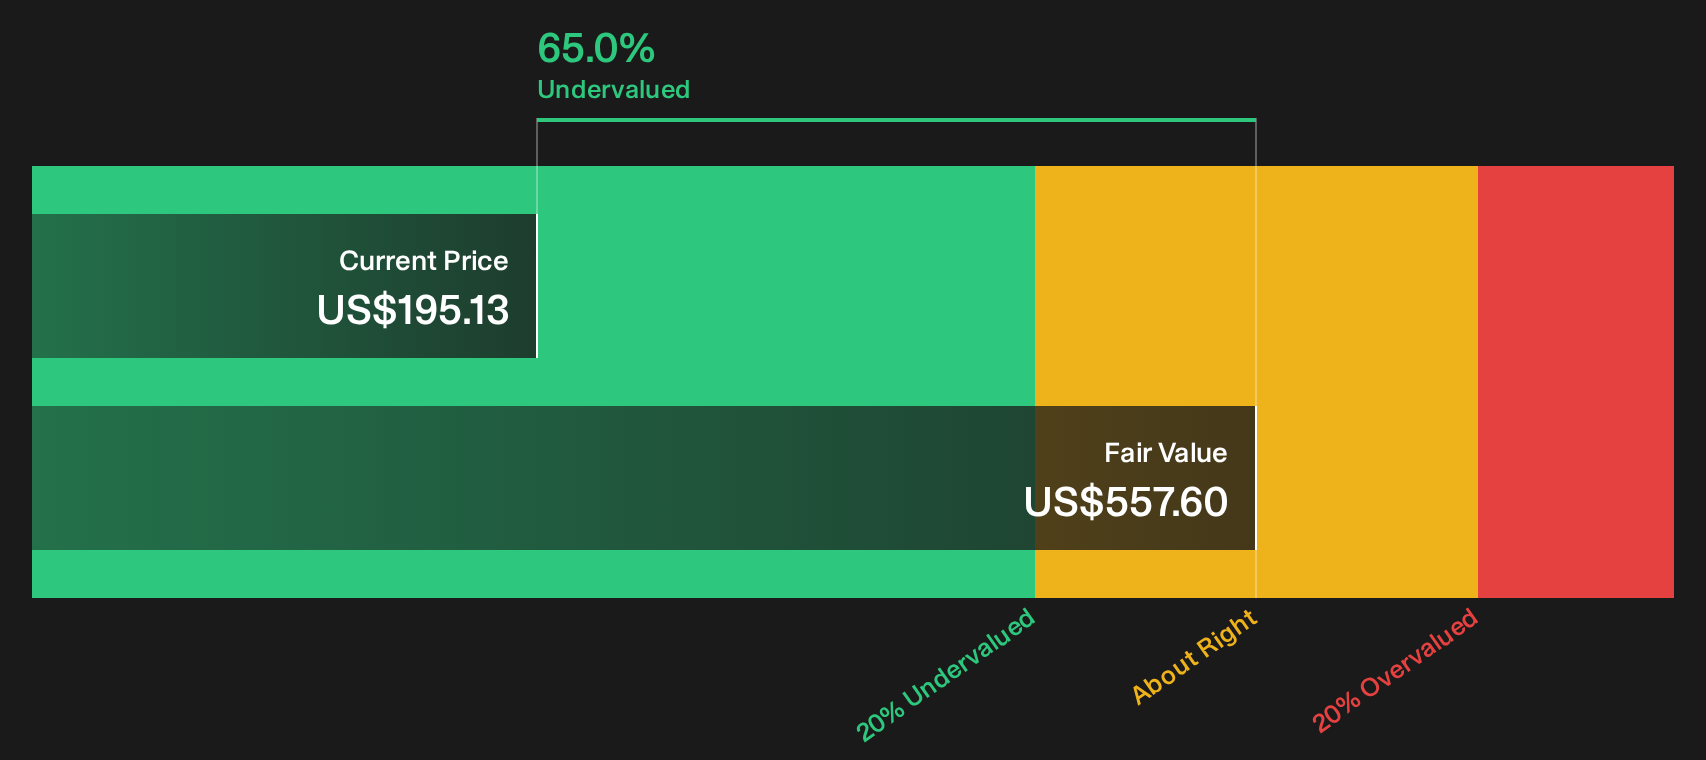
Simply Wall St performs a discounted cash flow (DCF) on every stock in the world every day (check out SK hynix for example). We show the entire calculation in full. You can track the result in your watchlist or portfolio and be alerted when this changes, or use our stock screener to discover 53 high quality undervalued stocks. If you save a screener we even alert you when new companies match - so you never miss a potential opportunity.
Next Steps
With SK hynix drawing mixed reactions, do you want to rely on the headline or test the numbers yourself and move quickly while sentiment is in flux? Use the full breakdown of 3 key rewards and 2 important warning signs
Looking for more SK hynix style investment ideas?
If SK hynix has sharpened your focus on valuation and risk, do not stop here. Use targeted screeners to uncover other stocks that might fit your approach.
- Target potential mispricings by scanning a curated set of 53 high quality undervalued stocks that combine solid fundamentals with attractive valuations.
- Strengthen your income focus by reviewing 10 dividend fortresses that pair higher yields with an emphasis on resilience.
- Prioritise resilience by checking 80 resilient stocks with low risk scores that score well on risk while still offering room for returns.
This article by Simply Wall St is general in nature. We provide commentary based on historical data and analyst forecasts only using an unbiased methodology and our articles are not intended to be financial advice. It does not constitute a recommendation to buy or sell any stock, and does not take account of your objectives, or your financial situation. We aim to bring you long-term focused analysis driven by fundamental data. Note that our analysis may not factor in the latest price-sensitive company announcements or qualitative material. Simply Wall St has no position in any stocks mentioned.