

St. Joe (JOE) Could Be 127% Below Fair Value Following Record Second Quarter Results
St. Joe Company JOE | 0.00 |
St. Joe (JOE) just posted its highest second quarter revenue and net income in 20 years, alongside an ongoing dividend and active share repurchases, drawing fresh attention to how the company is allocating capital.
That backdrop of record second quarter results appears to sit alongside building momentum in St. Joe's stock, with a 12.61% year to date share price return and a 35.34% total shareholder return over the past year at a recent share price of $67.35.
If this kind of re rating has you thinking about what else might be on the move, it could be worth scanning for other real estate businesses with long term owner focus through the 19 top founder-led companies
For St. Joe, the recent share price strength sits alongside record second quarter earnings, stronger margins and ongoing buybacks. Is the stock now mostly reflecting that progress, or has sentiment moved ahead of what the business supports on valuation?
Price to earnings on St. Joe: Is the premium multiple doing all the heavy lifting?
On the numbers provided, St. Joe looks cheap on one common yardstick but expensive on another, which puts the current $67.35 share price in an interesting spot for valuation focused investors.
The SWS DCF model estimates a future cash flow value of $152.60 per share, which is well above the recent price and implies a wide valuation gap based on discounted future cash flows. At the same time, St. Joe trades on a P/E ratio of 31.2x, which is higher than both the peer group average of 27x and the broader US Real Estate industry average of 17.7x, so the market is already putting a premium on today's earnings.
A P/E multiple reflects what investors are willing to pay today for each dollar of current earnings. For a real estate development and operating business like St. Joe, a higher P/E often signals that investors are assigning value to factors such as recent earnings growth, perceived quality of earnings and management, and expectations for how current projects and assets will convert into future profits. In St. Joe's case, the company is reporting high quality earnings, 48.7% earnings growth over the past year, stronger net profit margins at 22.5% compared with 19.4% last year, and a 10.2% annual earnings growth rate over the past five years. This gives some context for why the market might be comfortable paying above average multiples.
The DCF outcome and the P/E premium tell slightly different stories. The DCF suggests the market price could be well below the modelled future cash flow value, while the earnings multiple suggests investors are already paying more for each dollar of current profit than they are for many real estate peers. That combination means a lot of the debate now sits around whether recent profit growth and high quality earnings can be sustained enough to close that gap, or whether the premium P/E leaves less room for disappointment compared with lower multiple stocks in the sector.
Result: Price-to-earnings of 31.2x (OVERVALUED)
However, St. Joe is still exposed to concentration in a single US market and relies on real estate demand across its Residential, Hospitality, and Commercial segments holding up.
Another view on St. Joe's value
St. Joe appears expensive on its 31.2x P/E compared with peers and the wider US Real Estate sector. Yet the SWS DCF model presents a different perspective, with an estimated future cash flow value of $152.60 per share versus a recent price of $67.35. That difference raises the key question of which lens investors place more weight on.
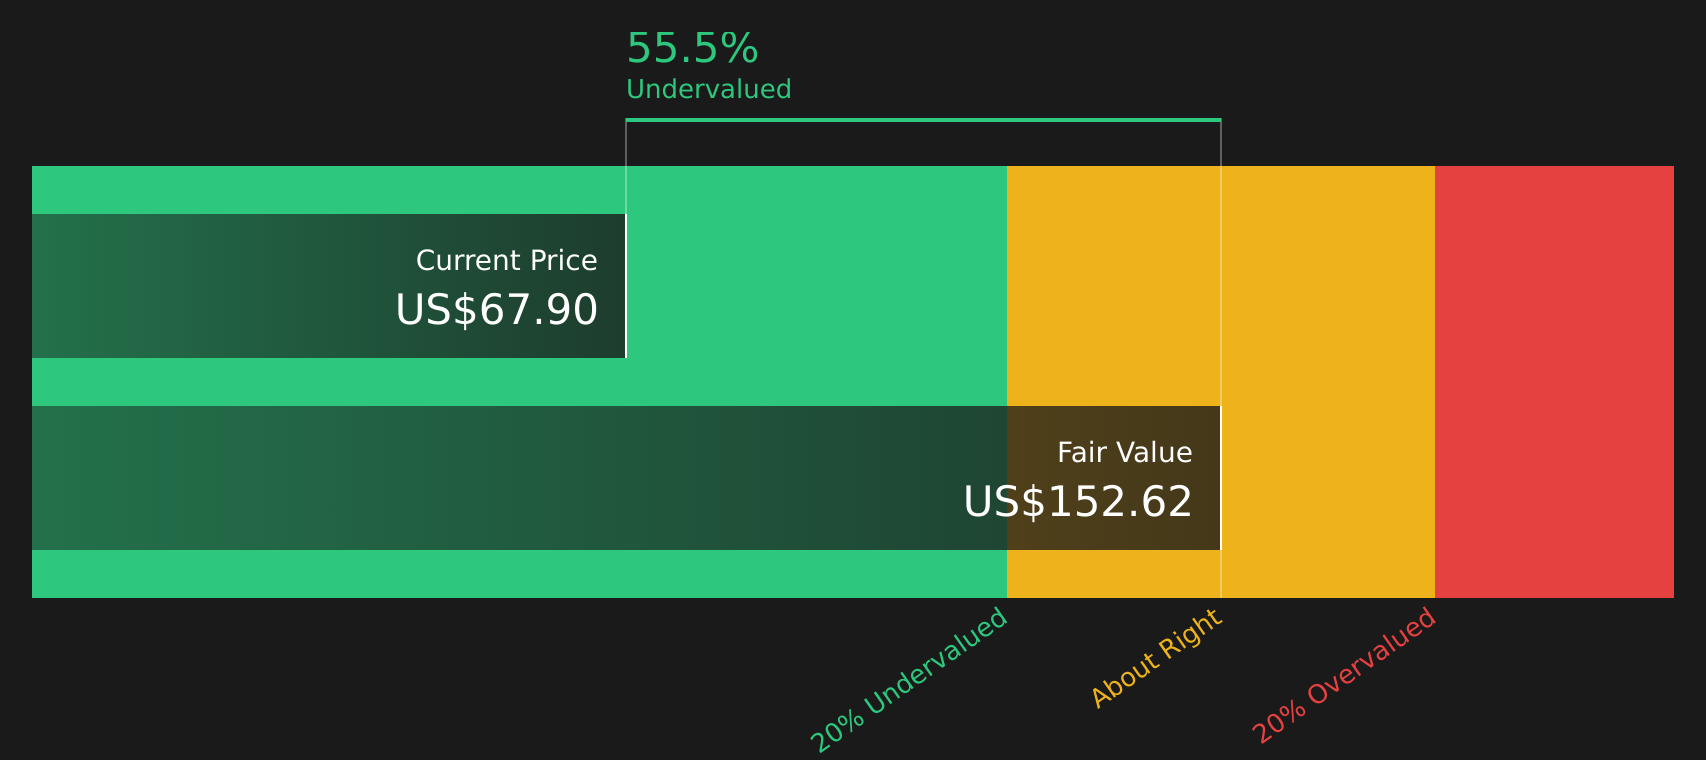
Simply Wall St performs a discounted cash flow (DCF) on every stock in the world every day (check out St. Joe for example). We show the entire calculation in full. You can track the result in your watchlist or portfolio and be alerted when this changes, or use our stock screener to discover 52 high quality undervalued stocks. If you save a screener we even alert you when new companies match - so you never miss a potential opportunity.
Next Steps
With St. Joe, the signals appear mixed enough that it makes sense to review the details yourself and act while the information is current. To see both sides of the story, review the 2 key rewards and 1 important warning sign
Looking for more investment ideas beyond St. Joe?
If St. Joe has you rethinking your watchlist, do not stop here. Broaden your options and give yourself more ways to react when markets move.
- Spot potential value opportunities early by scanning screener containing 21 high quality undiscovered gems that combine strong fundamentals with lower market attention.
- Prioritise resilience by checking 83 resilient stocks with low risk scores that score well on financial strength and lower risk profiles.
- Target quality balance sheets by reviewing the solid balance sheet and fundamentals stocks screener (48 results) before the crowd catches on.
This article by Simply Wall St is general in nature. We provide commentary based on historical data and analyst forecasts only using an unbiased methodology and our articles are not intended to be financial advice. It does not constitute a recommendation to buy or sell any stock, and does not take account of your objectives, or your financial situation. We aim to bring you long-term focused analysis driven by fundamental data. Note that our analysis may not factor in the latest price-sensitive company announcements or qualitative material. Simply Wall St has no position in any stocks mentioned.