StoneX Group (SNEX) Stock Price Run Raises Fresh Valuation Questions
StoneX Group Inc. SNEX | 0.00 |
StoneX Group (SNEX) is back in the spotlight after recent media coverage of its share price rise, strong revenue and earnings figures, solid balance sheet, and ongoing debate around whether the current valuation is stretched.
The share price momentum in StoneX Group has been strong, with a 30 day share price return of 19.73%, a 90 day move of 91.93%, and a 1 year total shareholder return of 132.28%, pointing to steadily building enthusiasm around the stock despite recent questions over valuation and insider selling.
If you are reassessing opportunities after StoneX Group's strong run, this can be a useful moment to see what else the market is rewarding through the 20 top founder-led companies
So with StoneX Group stock now trading above the average analyst price target and value scores looking weak, is the recent surge an overreaction that leaves little on the table, or is the market starting to price in more growth?
Price-to-Earnings of 23.5x: Is it justified?
On a simple snapshot, StoneX Group trades on a P/E of 23.5x, which screens as expensive against an estimated fair P/E of 15.8x, yet still sits below many peers.
The P/E multiple captures how much investors are currently paying for each dollar of StoneX Group's earnings. It is a common lens for capital markets companies with consistent profit generation.
For StoneX Group, earnings quality screens well and profit growth has been strong over both one-year and five-year periods. This can help explain why the stock supports a higher earnings multiple, even if it sits above the level that regression based fair value work suggests the market could eventually gravitate toward.
Compared with the broader US Capital Markets industry average P/E of 40.4x and a peer average of 24.3x, StoneX Group's 23.5x multiple looks more restrained. It is still comfortably ahead of the 15.8x fair P/E estimate that implies the market is paying a premium versus that fair ratio benchmark.
Result: Price-to-Earnings of 23.5x (OVERVALUED)
However, there are clear risks for StoneX Group if earnings momentum stalls or sector sentiment cools. This could pressure a P/E that already screens as rich.
Another View: StoneX Group Through a Cash Flow Lens
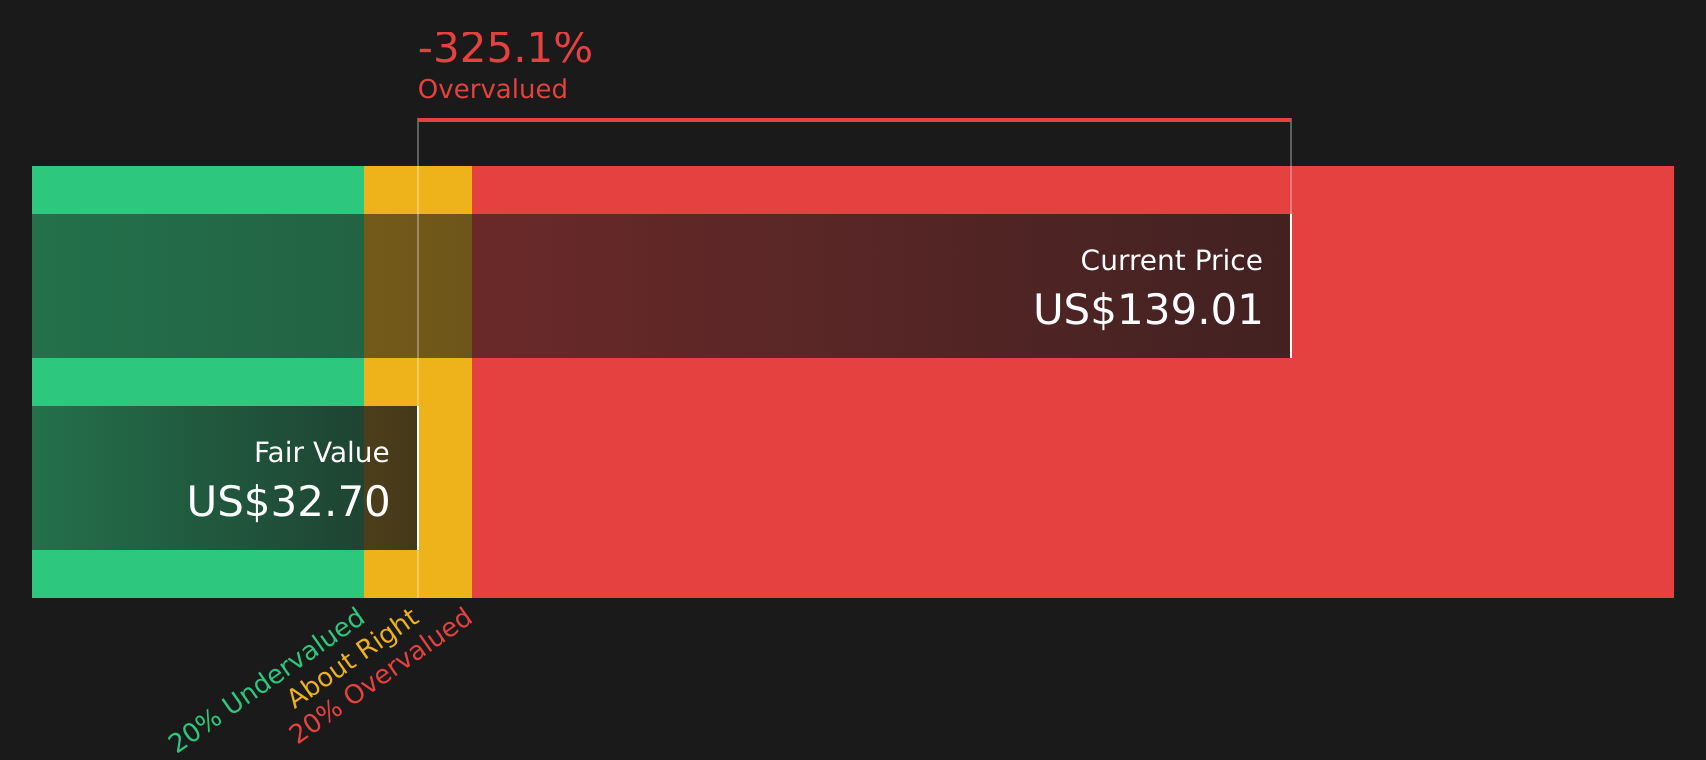
While the P/E of 23.5x suggests StoneX Group stock is expensive versus its 15.8x fair ratio, the SWS DCF model comes out even harsher. With StoneX Group at $132.66 compared with an estimated future cash flow value of $31.90, the model points to a stock that screens as heavily overvalued. Which signal should carry more weight for you right now?
Simply Wall St performs a discounted cash flow (DCF) on every stock in the world every day (check out StoneX Group for example). We show the entire calculation in full. You can track the result in your watchlist or portfolio and be alerted when this changes, or use our stock screener to discover 48 high quality undervalued stocks. If you save a screener we even alert you when new companies match - so you never miss a potential opportunity.
Next Steps
With StoneX Group's strong share price run and mixed valuation signals, are you comfortable with the balance of concerns and potential? Act promptly, review the underlying numbers, and weigh both sides of the story through the 3 key rewards and 1 important warning sign
Looking for more ideas beyond StoneX Group stock?
If StoneX Group has sharpened your focus, use this moment to widen your opportunity set and scan for other stocks that might better fit your plan.
- Target steadier compounding potential by reviewing companies that pass our 65 resilient stocks with low risk scores.
- Hunt for potential mispricings by checking the screener containing 20 high quality undiscovered gems before they attract broader attention.
- Focus on fundamentals first and shortlist candidates through the solid balance sheet and fundamentals stocks screener (48 results).
This article by Simply Wall St is general in nature. We provide commentary based on historical data and analyst forecasts only using an unbiased methodology and our articles are not intended to be financial advice. It does not constitute a recommendation to buy or sell any stock, and does not take account of your objectives, or your financial situation. We aim to bring you long-term focused analysis driven by fundamental data. Note that our analysis may not factor in the latest price-sensitive company announcements or qualitative material. Simply Wall St has no position in any stocks mentioned.