Symbotic (SYM) Valuation Check After GAAP Profitability, Revenue Outlook Upgrade And Fox Robotics Acquisition
Symbotic, Inc. Class A SYM | 56.56 | +3.57% |
Symbotic (SYM) just posted its fiscal first quarter results, reporting GAAP profitability of US$2.6 million on US$629.99 million in revenue. The company also issued a revenue outlook of US$650 million to US$670 million for next quarter.
The latest earnings and revenue outlook have coincided with an 11.08% 1 day share price return and a 9.88% 7 day share price return, even though the 30 day and 90 day share price returns are both around a 14% decline. Over the longer run, the 1 year total shareholder return of 126.55% and 3 year total shareholder return of about 2.4x suggest momentum has been strong despite recent volatility.
If this warehouse automation story has your attention, it may be a good time to see what else is moving in AI robotics through our list of 28 robotics and automation stocks.
After a huge run over the past three years and a pullback in recent months, Symbotic now trades only slightly below the average analyst target. This raises a key question for investors: is there still an opportunity here, or is the market already pricing in future growth?
Most Popular Narrative: 5.6% Undervalued
With Symbotic last closing at $59.74 and the most followed narrative pointing to a fair value of about $63.25, the gap between price and narrative expectations is relatively modest but still meaningful for investors watching the story closely.
Increasing software and service revenue software maintenance gross margins exceeding 70% and more than doubling year over year demonstrates significant operating leverage and margin expansion, positioning Symbotic for greater profitability as its installed base scales.
Curious what earnings profile could sit behind that kind of software margin mix, and what sort of future P/E those assumptions lean on? The most popular narrative combines rapid top line expansion, a sharp swing into profitability, and a rich earnings multiple to bridge from today’s price to that fair value number. The full story connects those moving parts into one valuation roadmap, so it is worth reviewing if you want to understand how that $63.25 figure is built.
Result: Fair Value of $63.25 (UNDERVALUED)
However, this narrative could be knocked off course if deployment delays tied to the new storage structure persist, or if customer concentration, particularly around Walmart, starts to bite.
Another Lens: Our DCF Model Sees Less Upside
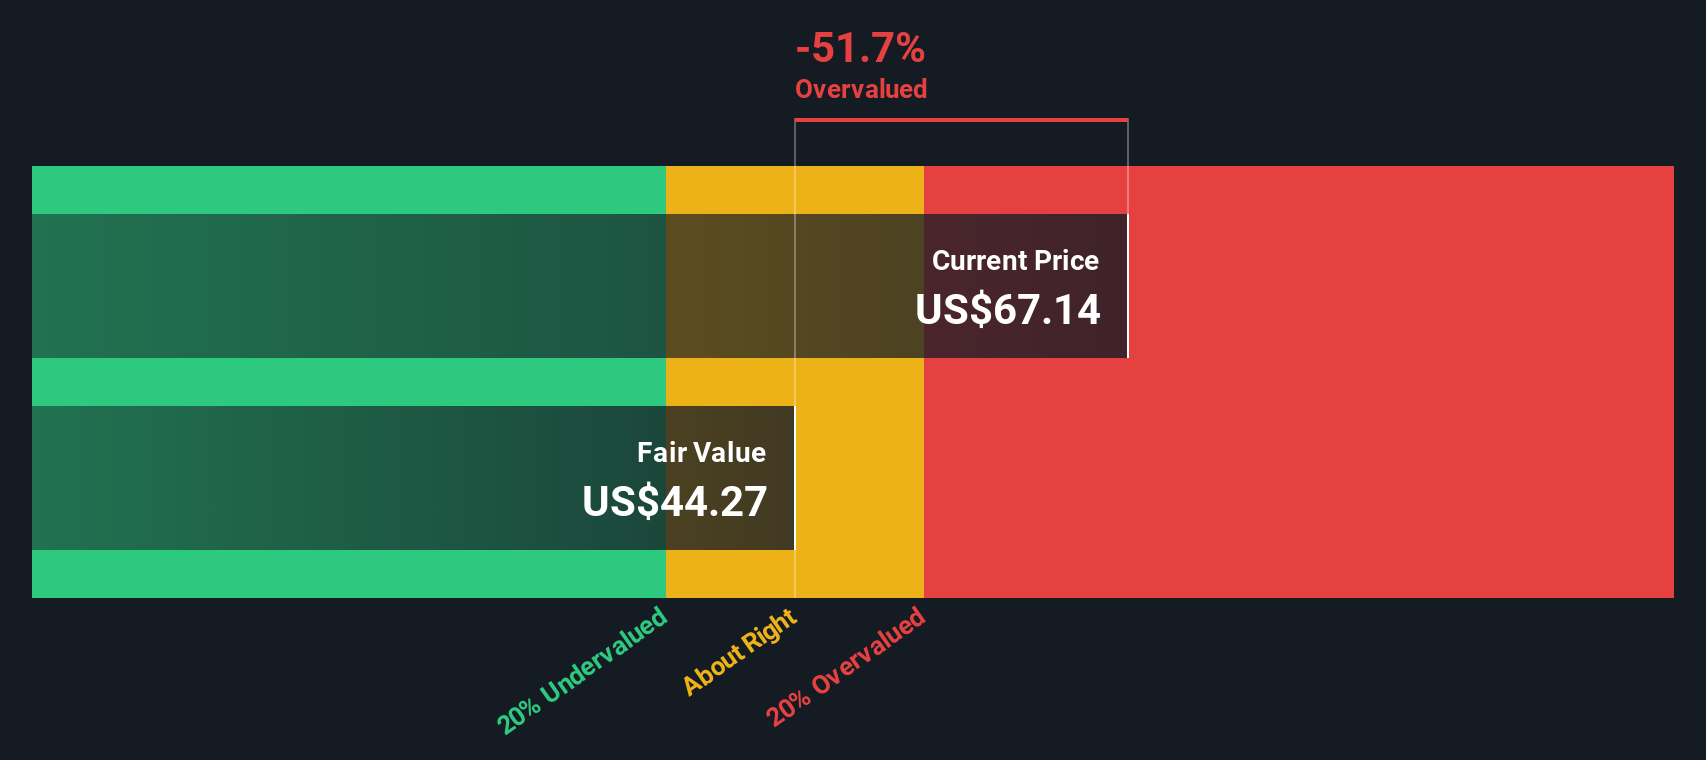
While the popular narrative pins fair value at about $63.25, the SWS DCF model comes out far more cautious, at roughly $47.23 per share. This implies Symbotic at $59.74 is trading above its future cash flow value. So which story do you think better fits the risk you are willing to take?
Simply Wall St performs a discounted cash flow (DCF) on every stock in the world every day (check out Symbotic for example). We show the entire calculation in full. You can track the result in your watchlist or portfolio and be alerted when this changes, or use our stock screener to discover 53 high quality undervalued stocks. If you save a screener we even alert you when new companies match - so you never miss a potential opportunity.
Build Your Own Symbotic Narrative
If you are not fully on board with these assumptions, or simply prefer your own research path, you can stress test the same data and shape a version that fits your view with Do it your way.
A great starting point for your Symbotic research is our analysis highlighting 2 key rewards and 2 important warning signs that could impact your investment decision.
Looking for more investment ideas?
If Symbotic has sharpened your focus, do not stop here. The same screener tools can help you uncover other opportunities that might fit your style even better.
- Target quality at a discount by reviewing our list of 53 high quality undervalued stocks that pair solid fundamentals with prices that may not fully reflect them yet.
- Prioritise resilience by scanning 86 resilient stocks with low risk scores that score well on our risk checks and could help you balance bolder positions in your portfolio.
- Get ahead of the crowd by checking the screener containing 24 high quality undiscovered gems that our filters flag as strong on fundamentals but not widely followed.
This article by Simply Wall St is general in nature. We provide commentary based on historical data and analyst forecasts only using an unbiased methodology and our articles are not intended to be financial advice. It does not constitute a recommendation to buy or sell any stock, and does not take account of your objectives, or your financial situation. We aim to bring you long-term focused analysis driven by fundamental data. Note that our analysis may not factor in the latest price-sensitive company announcements or qualitative material. Simply Wall St has no position in any stocks mentioned.