

Tango Therapeutics (TNGX) Is Getting Fresh Attention, What Are Investors Looking At?
Tango Therapeutics, Inc. TNGX | 0.00 |
Tango Therapeutics (TNGX) moved after investors focused on a wider Q2 net loss, the end of collaboration revenue, and a newly filed US$400 million at-the-market equity offering that could dilute existing shareholders.
Tango Therapeutics shares have cooled off in the short term, with a 7 day share price return of down 11.6% and a 30 day share price return of down 13.5%. However, momentum over longer periods remains strong, including a year to date share price return of 187.2% and a very large 1 year total shareholder return of 270.7% that reflect shifting expectations around its pipeline and risk profile.
If you are looking beyond Tango Therapeutics and want to see what else is moving in healthcare, this is a good moment to check out 44 healthcare AI stocks.
Tango Therapeutics now trades well below both analyst targets and an intrinsic value estimate, even after a sharp pullback. Does that gap highlight a potential opportunity, or does it suggest that recent enthusiasm has moved ahead of fundamentals?
Preferred Price to Book of 4.2x: Is it justified?
Tango Therapeutics currently trades on a Price to Book, or P/B, ratio of 4.2x, which sits below some peers yet above the broader US biotech industry average.
The P/B ratio compares a company’s market value to its accounting book value. For a business like Tango Therapeutics that is still loss making, investors often look at P/B instead of earnings based multiples because profits are not yet available to anchor valuation.
According to Simply Wall St data, Tango Therapeutics is considered good value when compared with its direct peer group, with a P/B of 4.2x versus a peer average of 4.8x. However, the same 4.2x looks expensive relative to the wider US biotechs industry, where the average P/B is 2.5x. That gap suggests investors are assigning a richer valuation than the typical biotech company, even though the stock screens a little cheaper than its closer peer set.
Result: Preferred multiple of Price to Book of 4.2x (ABOUT RIGHT)
However, Tango Therapeutics still faces clear risks, including ongoing losses of US$123.7 million and dependence on successful outcomes from its early stage oncology pipeline.
Another View on Tango Therapeutics Using the SWS DCF Model
The earlier discussion looked at Tango Therapeutics through a P/B ratio lens. A different picture comes from the SWS DCF model, which suggests a fair value of about $43.67 per share versus the current $25.65. That gap points to potential undervaluation. Could the cash flow outlook be highlighting factors that a simple balance sheet metric does not capture?
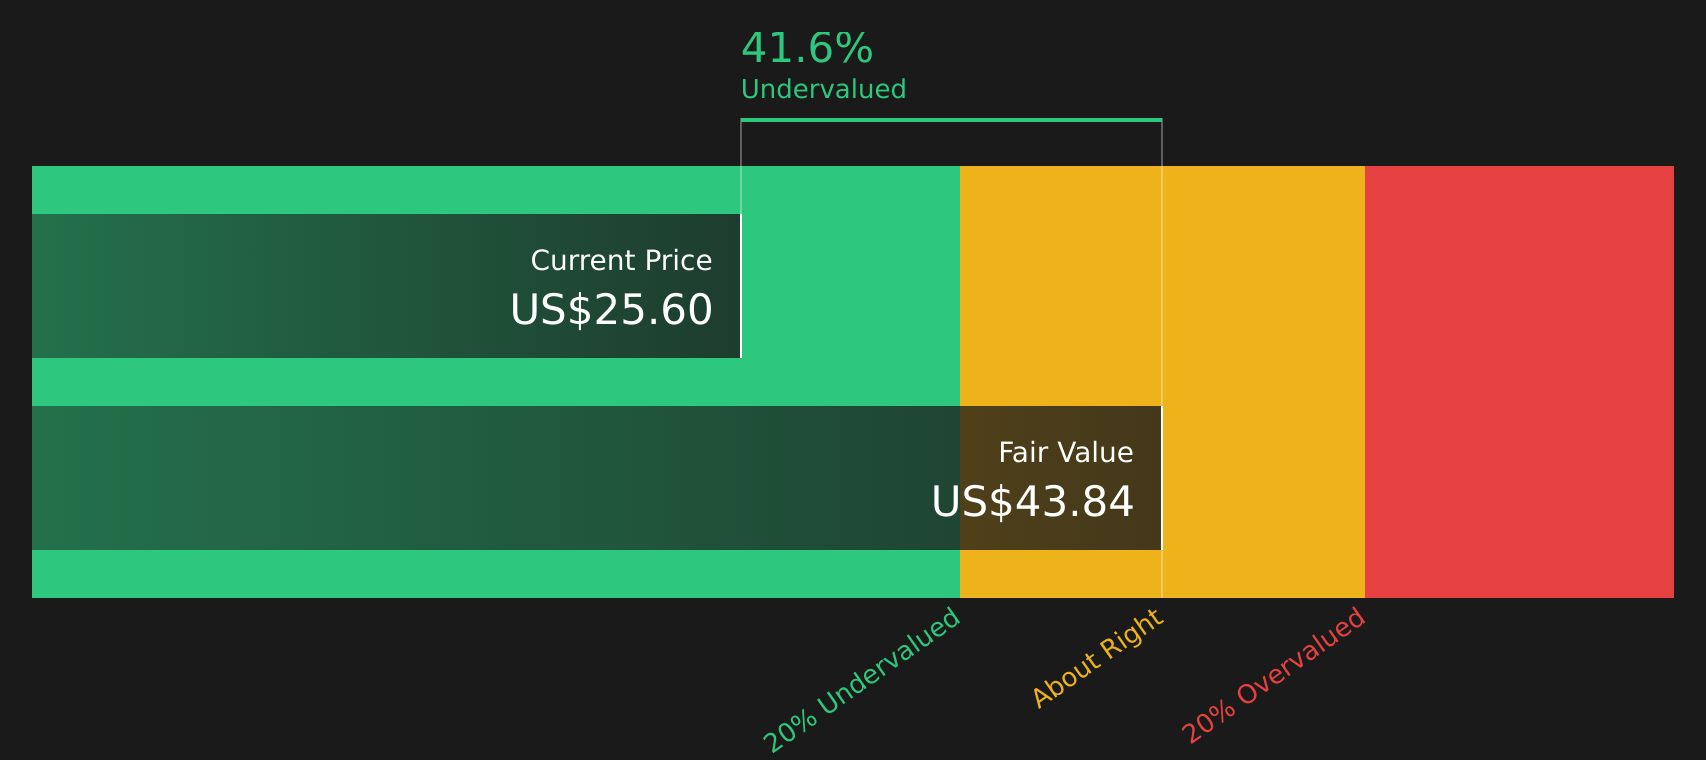
Simply Wall St performs a discounted cash flow (DCF) on every stock in the world every day (check out Tango Therapeutics for example). We show the entire calculation in full. You can track the result in your watchlist or portfolio and be alerted when this changes, or use our stock screener to discover 51 high quality undervalued stocks. If you save a screener we even alert you when new companies match - so you never miss a potential opportunity.
Next Steps
Given the mixed signals around Tango Therapeutics, it makes sense to move quickly and check the underlying data for yourself. To weigh up both the potential upside and the areas of concern, start with the 2 key rewards and 3 important warning signs.
Looking for more investment ideas beyond Tango Therapeutics?
Do not stop with Tango Therapeutics. Broaden your watchlist now with focused stock ideas built from the same data driven process investors use to assess this company.
- Spot potential mispricings early by checking stocks that screen as good value in the 51 high quality undervalued stocks.
- Prioritise resilience by reviewing companies highlighted in the 88 resilient stocks with low risk scores.
- Hunt for lesser known potential opportunities by scanning the screener containing 18 high quality undiscovered gems.
This article by Simply Wall St is general in nature. We provide commentary based on historical data and analyst forecasts only using an unbiased methodology and our articles are not intended to be financial advice. It does not constitute a recommendation to buy or sell any stock, and does not take account of your objectives, or your financial situation. We aim to bring you long-term focused analysis driven by fundamental data. Note that our analysis may not factor in the latest price-sensitive company announcements or qualitative material. Simply Wall St has no position in any stocks mentioned.