Tapestry (TPR) Stock After 72% One-Year Rally Is The Current Price Justified
Tapestry TPR | 0.00 |
- Investors may be wondering whether Tapestry stock still offers value after its strong run, or if most of the upside is already reflected in the price.
- The stock recently closed at US$143.50, with returns of 3.6% over the last month, 11.2% year to date and 72.4% over the past year. The three and five year returns are also very large at about 2.6x and 2.8x respectively.
- These moves have come as Tapestry continues to attract attention from investors focusing on its long term positioning and market presence. Broader interest in consumer brands has kept the stock on many watchlists, even as sentiment shifts between caution and optimism.
- Despite this performance, Tapestry currently has a valuation score of 1/6, which means it only screens as undervalued on one of six checks. The next sections will unpack what different valuation methods suggest about the stock and then conclude with a more complete way to think about value beyond the usual ratios.
Tapestry scores just 1/6 on our valuation checks. See what other red flags we found in the full valuation breakdown.
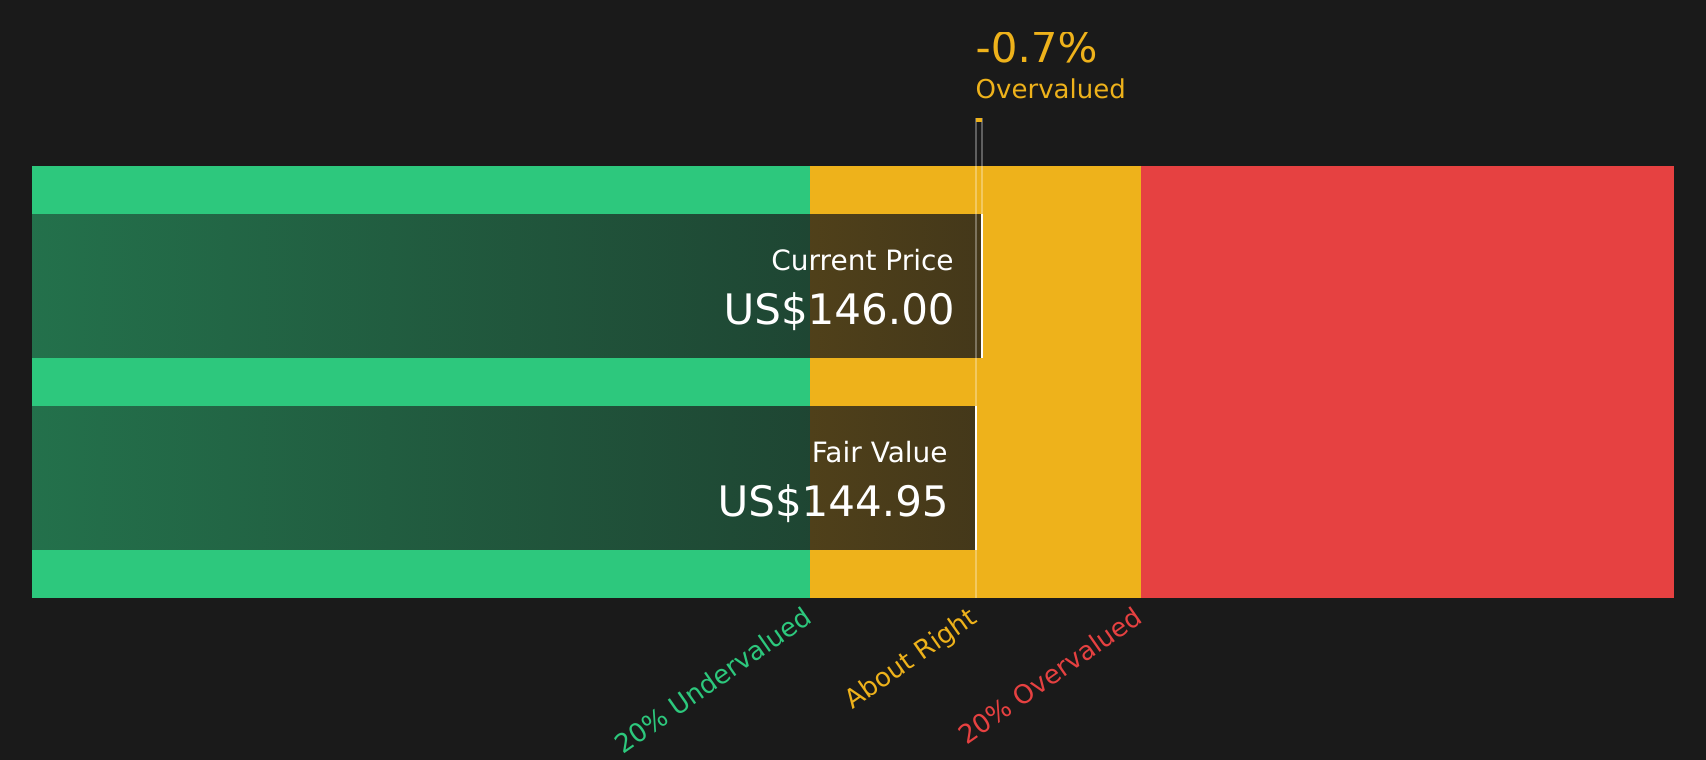
Approach 1: Tapestry Discounted Cash Flow (DCF) Analysis
A Discounted Cash Flow, or DCF, model estimates what Tapestry might be worth by projecting future cash flows and then discounting them back to today using a required return. It focuses on the cash the company could generate for shareholders over time rather than current earnings alone.
For Tapestry, the model uses a 2 Stage Free Cash Flow to Equity approach. The latest twelve month Free Cash Flow is about $1.76b. Analyst projections and subsequent extrapolations by Simply Wall St point to Free Cash Flow of about $2.12b in 2035, with intermediate years ranging from about $1.55b in 2026 to $2.05b in 2034. These projected cash flows, all in $, are discounted to today to estimate the company’s total equity value per share.
This DCF output suggests an intrinsic value of roughly $144.20 per share, compared with the recent share price of $143.50. That implies the stock screens as about 0.5% undervalued, which is effectively in line with the current market price.
Result: ABOUT RIGHT
Tapestry is fairly valued according to our Discounted Cash Flow (DCF), but this can change at a moment's notice. Track the value in your watchlist or portfolio and be alerted on when to act.
Approach 2: Tapestry Price vs Earnings
For a profitable company like Tapestry, the P/E ratio is a useful way to gauge what investors are currently willing to pay for each dollar of earnings. A higher or lower P/E often reflects what the market thinks about a company’s future prospects and the level of uncertainty around those earnings.
In general, stronger growth expectations and lower perceived risk can support a higher “normal” or “fair” P/E, while slower growth or higher risk usually point to a lower one. Tapestry currently trades on a P/E of about 43.7x. This sits above the Luxury industry average of about 23.6x and also above the peer group average of about 24.6x.
Simply Wall St’s Fair Ratio for Tapestry is 28.1x. This proprietary metric estimates what the P/E might be, given factors such as earnings growth, industry, profit margins, market cap and specific risks. Because it blends these company level inputs with industry context, it can give a more tailored view than a simple comparison with peers or sector averages. Comparing the Fair Ratio of 28.1x with the current P/E of 43.7x suggests Tapestry screens as overvalued on this earnings based approach.
Result: OVERVALUED

P/E ratios tell one story, but what if the real opportunity lies elsewhere? Start investing in legacies, not executives. Discover our 20 top founder-led companies.
Upgrade Your Decision Making: Choose your Tapestry Narrative
Earlier there was mention that there is an even better way to understand valuation, and on Simply Wall St this comes through Narratives, where you set out your story for Tapestry, link that story to concrete assumptions for future revenue, earnings and margins, and the platform turns it into a forecast, a Fair Value and an ongoing comparison with the current share price that updates automatically as new earnings or news arrive.
Because Narratives live on the Community page and are used by millions of investors, they make it straightforward to see how different viewpoints translate into numbers. For example, one Tapestry Narrative might lean toward the higher US$205 Fair Value with stronger revenue growth, higher margins and a P/E of 23.3x. A more cautious Narrative might sit closer to US$111.38 with lower assumed growth and a 16.1x P/E. You can compare those Fair Values with today’s price to decide whether you think the stock looks expensive or inexpensive relative to your own storyline.
For Tapestry however we will make it really easy for you with previews of two leading Tapestry Narratives:
Fair value: US$205.00
Implied undervaluation vs last close: about 30.0%
Revenue growth used in this narrative: 7.42%
- Assumes faster expansion in international markets and among younger customers, with digital and direct to consumer channels supporting higher margins over time.
- Builds in higher long term earnings, share repurchases and the use of AI tools such as the Mira platform to improve decisions and profitability.
- Recognises risks around tariffs, reliance on Coach and potential brand dilution, but concludes that stronger growth and a higher future P/E still support a higher fair value.
Fair value: US$111.38
Implied overvaluation vs last close: about 28.8%
Revenue growth used in this narrative: 4.51%
- Applies more cautious assumptions on revenue growth, with concerns about conscious consumer trends, digital first competitors and brand fatigue for labels like Coach and Kate Spade.
- Builds in higher ongoing costs from tariffs, regulation and compliance, which could weigh on margins even if earnings still grow.
- Assumes a lower future P/E multiple and concludes that current expectations embedded in the share price may be too high relative to these risks.
These contrasting Narratives give you a structured way to stress test your own view on Tapestry by choosing which growth, margin and valuation assumptions feel closest to what you think is realistic for the business over the next few years.
Do you think there's more to the story for Tapestry? Head over to our Community to see what others are saying!

This article by Simply Wall St is general in nature. We provide commentary based on historical data and analyst forecasts only using an unbiased methodology and our articles are not intended to be financial advice. It does not constitute a recommendation to buy or sell any stock, and does not take account of your objectives, or your financial situation. We aim to bring you long-term focused analysis driven by fundamental data. Note that our analysis may not factor in the latest price-sensitive company announcements or qualitative material. Simply Wall St has no position in any stocks mentioned.