TFS Financial (TFSL) Stock Looks Rich After Rally to $16.42
TFS Financial Corporation TFSL | 0.00 |
TFS Financial (TFSL) has drawn investor attention after a recent move in its share price, with the stock closing at $16.42. That shift is prompting a closer look at recent returns and fundamentals.
For context, TFS Financial’s recent move to $16.42 comes after a 22.63% 90 day share price return and a 40.10% 1 year total shareholder return, suggesting momentum has been building over both shorter and longer periods.
If this kind of steady progress has your attention, it could be a good moment to broaden your watchlist and check out 20 top founder-led companies
With TFS Financial now trading around $16.42 and sitting at a premium to the current analyst price target and intrinsic value estimate, is there still an underappreciated opportunity here or is the market already pricing in future growth?
Price-to-Earnings of 50x: Is it justified?
TFS Financial is currently trading on a P/E of 50x, which is high relative to many US bank stocks, and that stands out at a share price of $16.42.
The P/E ratio compares the share price to earnings per share, so a higher figure usually means investors are paying more today for each dollar of current earnings. For a bank such as TFS Financial, a rich P/E can reflect expectations for steady earnings growth, perceived balance sheet strength, or the appeal of its dividend profile. It can also signal that a lot of optimism is already embedded in the price.
Here, the data points to a valuation that is well above several reference points. TFS Financial is described as expensive versus the US Banks industry average P/E of 11.7x, the peer average of 12.9x, and an estimated fair P/E of 12.1x that the market could potentially gravitate toward if sentiment cools or earnings do not keep pace with expectations.
Result: Price-to-Earnings of 50x (OVERVALUED)
However, TFS Financial’s rich 50x P/E, premium to the $15.50 analyst target and intrinsic value estimate leaves limited room if sentiment weakens or earnings underperform expectations.
Another view on TFS Financial’s valuation
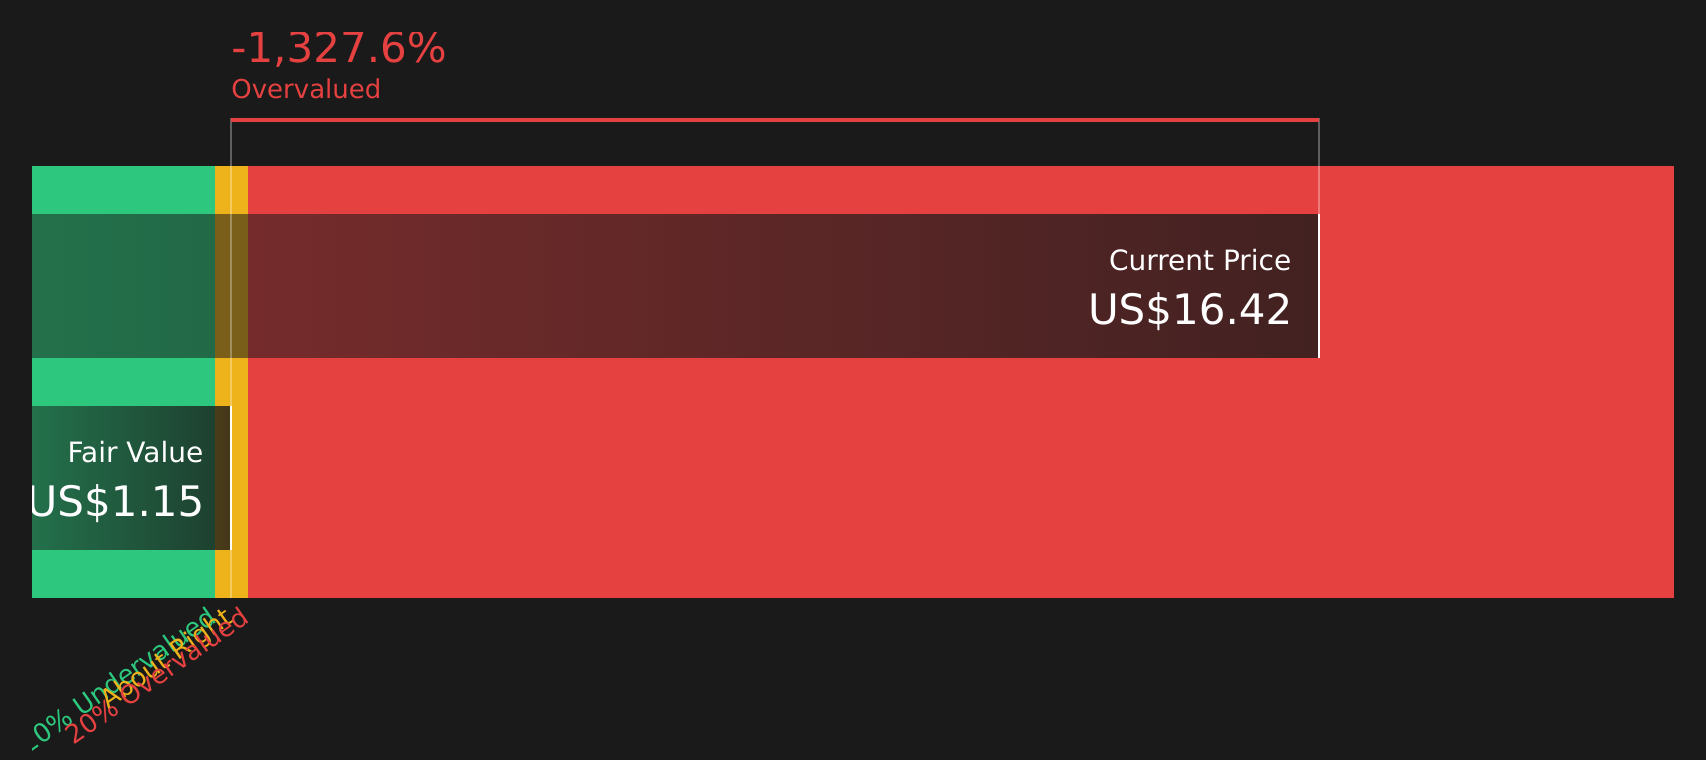
While the 50x P/E suggests TFS Financial is expensive, the SWS DCF model presents an even more conservative view, with an estimate of future cash flow value at $1.15 versus the current $16.42 share price. On this measure, the stock screens as heavily overvalued.
Our DCF model is just one framework, and like any model it depends on assumptions about future cash flows and discount rates that may or may not play out as expected. The key question for you is which story you place more weight on, the market price or the cash flow analysis, and what that means for your own risk tolerance.
Simply Wall St performs a discounted cash flow (DCF) on every stock in the world every day (check out TFS Financial for example). We show the entire calculation in full. You can track the result in your watchlist or portfolio and be alerted when this changes, or use our stock screener to discover 45 high quality undervalued stocks. If you save a screener we even alert you when new companies match - so you never miss a potential opportunity.
Next Steps
Given the mixed signals around TFS Financial’s valuation, it makes sense to review the underlying data, weigh both the concerns and the upside, and then decide how that fits your own risk profile by checking the 2 key rewards and 1 important warning sign.
Looking for more investment ideas beyond TFS Financial?
If TFS Financial has sharpened your focus on valuation and risk, do not stop here. Use the Simply Wall St screener to compare other opportunities side by side.
- Spot potential bargains early by reviewing companies on the 45 high quality undervalued stocks that pair quality fundamentals with prices that may not fully reflect them.
- Strengthen your income stream by scanning the 8 dividend fortresses for stocks offering higher yields backed by supporting financial metrics.
- Prioritize resilience by focusing on companies in the 66 resilient stocks with low risk scores that score well on balance sheet strength and risk factors.
This article by Simply Wall St is general in nature. We provide commentary based on historical data and analyst forecasts only using an unbiased methodology and our articles are not intended to be financial advice. It does not constitute a recommendation to buy or sell any stock, and does not take account of your objectives, or your financial situation. We aim to bring you long-term focused analysis driven by fundamental data. Note that our analysis may not factor in the latest price-sensitive company announcements or qualitative material. Simply Wall St has no position in any stocks mentioned.