TFS Financial (TFSL) Valuation Check After Recent Share Price Momentum
TFS Financial Corporation TFSL | 14.50 14.50 | -0.82% 0.00% Post |
What recent performance says about TFS Financial
TFS Financial (TFSL) has caught investor attention after a recent share price move, with the stock showing gains over the past week, month, and past 3 months that stand out within regional banking peers.
The company reports annual revenue of US$327.371m and net income of US$89.338m. This gives investors concrete earnings to compare with its latest share price of US$14.92 and recent return profile.
Stepping back from the recent move, the 1-day share price return of 2.75% and 30-day share price return of 10.11% sit alongside a 1-year total shareholder return of 18.97%. Together, these figures point to steady momentum rather than a sudden shift in sentiment.
If you are looking beyond regional banks, this could be a good moment to widen your search and check out our list of 22 top founder-led companies as potential new ideas.
With TFSL trading around US$14.92 and sitting slightly above the analyst price target of US$14.50, along with an indicated intrinsic premium, you have to ask whether there is still a buying opportunity here or if future growth is already priced in.
Price-to-Earnings of 46.6x: Is it justified?
On a P/E of 46.6x at a last close of $14.92, TFS Financial screens as expensive compared to both its own estimated fair P/E and banking peers. For a regional bank with steady but not high forecast growth, that is a punchy valuation for the earnings currently on the table.
The P/E ratio tells you how much investors are paying for each dollar of current earnings, and for banks it is a quick shorthand for what the market expects from future profitability and risk. In this case, TFSL is trading well above the estimated fair P/E of 11.8x, a level that would imply a much lower price if the market eventually settled closer to that benchmark.
Compared with the US Banks industry average P/E of 12x and a peer average of 15.4x, TFSL’s 46.6x earnings multiple is far higher, suggesting the market is pricing in a very rich earnings profile relative to sector norms. If sentiment cools and valuation multiples move closer to the estimated fair ratio of 11.8x, that would imply a very different price anchor than today’s. Explore the SWS fair ratio for TFS Financial
Result: Price-to-Earnings of 46.6x (OVERVALUED)
However, that rich 46.6x P/E and premium to the US$14.50 price target leave TFSL exposed if investor sentiment or broader bank sector valuations cool.
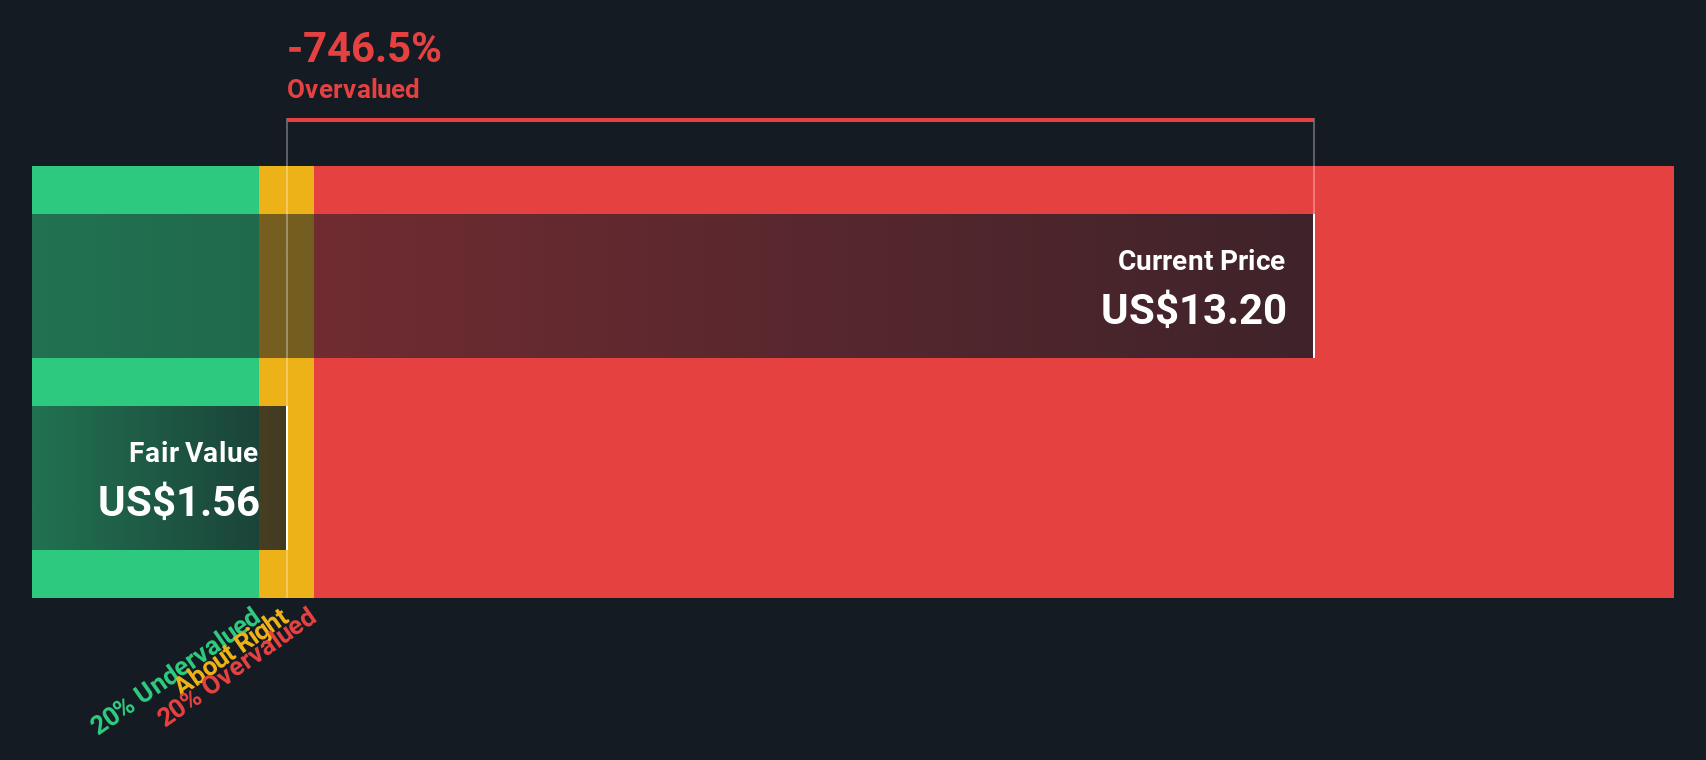
Another view: cash flows paint a starker picture
While the 46.6x P/E suggests TFS Financial is expensive, our DCF model goes further and indicates the current $14.92 share price sits well above an estimated future cash flow value of $1.29. That points to a wide gap between market optimism and cash flow support. Is that a margin of safety you are comfortable with?
Simply Wall St performs a discounted cash flow (DCF) on every stock in the world every day (check out TFS Financial for example). We show the entire calculation in full. You can track the result in your watchlist or portfolio and be alerted when this changes, or use our stock screener to discover 53 high quality undervalued stocks. If you save a screener we even alert you when new companies match - so you never miss a potential opportunity.
Build Your Own TFS Financial Narrative
If this view of TFS Financial does not fully line up with yours, or you prefer to weigh the numbers yourself, you can build a tailored storyline in just a few minutes, starting with Do it your way.
A great starting point for your TFS Financial research is our analysis highlighting 2 key rewards and 2 important warning signs that could impact your investment decision.
Ready to find your next idea?
If TFSL feels fully priced to you, do not stop here. Give yourself options by lining up a few fresh ideas before the market moves on.
- Target potential value by scanning our list of 53 high quality undervalued stocks that pair quality fundamentals with pricing that may still offer room for upside.
- Prioritise resilience by reviewing 86 resilient stocks with low risk scores that score well on stability, so sharp drawdowns are less likely to catch you off guard.
- Spot tomorrow's standouts early with a screener containing 24 high quality undiscovered gems before they sit on everyone else's watchlist instead of just yours.
This article by Simply Wall St is general in nature. We provide commentary based on historical data and analyst forecasts only using an unbiased methodology and our articles are not intended to be financial advice. It does not constitute a recommendation to buy or sell any stock, and does not take account of your objectives, or your financial situation. We aim to bring you long-term focused analysis driven by fundamental data. Note that our analysis may not factor in the latest price-sensitive company announcements or qualitative material. Simply Wall St has no position in any stocks mentioned.