The Bull Case For Newmont (NEM) Could Change Following Record Q1 Cash Flow And $6B Buyback
Newmont Corporation NEM | 0.00 |
- Newmont Corporation recently reported Q1 2026 results with record free cash flow of about US$3.10 billion on revenue of US$7.31 billion, while also approving an additional US$6 billion share repurchase program and maintaining its quarterly dividend at US$0.26 per share.
- Alongside these results, a planned retirement of long-serving Chief Technical Officer Francois Hardy and the interim appointment of Erin Workman highlight how Newmont is pairing leadership transition with substantial capital returns to shareholders.
- Now we’ll examine how Newmont’s record free cash flow and expanded US$6 billion buyback influence its existing investment narrative.
The future of work is here. Discover the 32 top robotics and automation stocks leading the charge in AI-driven automation and industrial transformation.
Newmont Investment Narrative Recap
To own Newmont today, you generally need to believe that strong gold prices and disciplined operations can translate into durable free cash flow, even as mines mature and capital needs rise. The latest Q1 2026 record free cash flow of about US$3.10 billion and the new US$6.0 billion buyback reinforce that cash generation is a near term catalyst, while the biggest current risk remains execution through a heavy capex and integration phase. The CTO transition itself does not appear to materially change that risk.
The most relevant recent announcement alongside Q1 results is the expanded US$6.0 billion share repurchase authorization. For investors, this decision sits right at the intersection of Newmont’s cash flow catalyst and its capital allocation risk: it amplifies the impact of strong quarters like Q1 2026, but it also increases reliance on sustaining high free cash flow once asset sales and grade-related tailwinds ease.
Yet behind the record cash flow and large buyback, investors should also be aware of growing pressure from rising sustaining capex and...
Newmont's narrative projects $21.6 billion revenue and $6.4 billion earnings by 2028. This requires 1.6% yearly revenue growth and about a $0.2 billion earnings increase from $6.2 billion today.
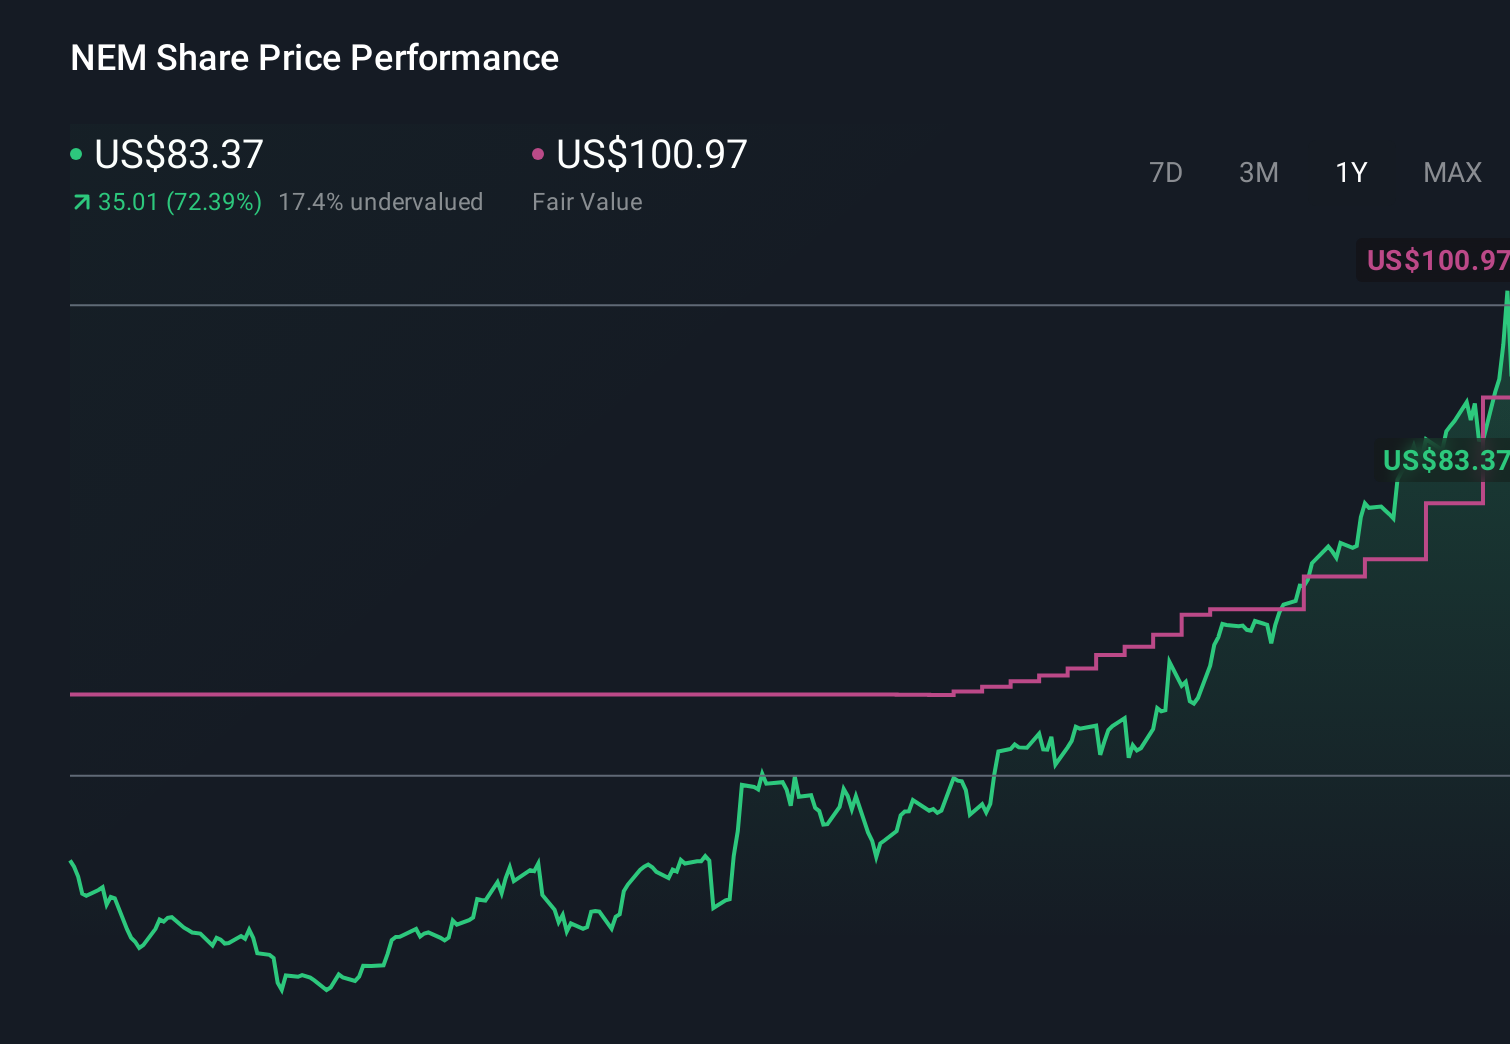
Uncover how Newmont's forecasts yield a $110.64 fair value, a 3% downside to its current price.
Exploring Other Perspectives
Some of the most pessimistic analysts were assuming Newmont’s revenue could shrink about 4 percent a year and still reach around US$22.0 billion by 2029, highlighting how differently you and other investors might weigh record free cash flow against concerns about higher long term costs and earnings volatility.
Explore 11 other fair value estimates on Newmont - why the stock might be worth 16% less than the current price!
Decide For Yourself
Disagree with existing narratives? Extraordinary investment returns rarely come from following the herd, so go with your instincts.
- A great starting point for your Newmont research is our analysis highlighting 4 key rewards and 1 important warning sign that could impact your investment decision.
- Our free Newmont research report provides a comprehensive fundamental analysis summarized in a single visual - the Snowflake - making it easy to evaluate Newmont's overall financial health at a glance.
Ready For A Different Approach?
Don't miss your shot at the next 10-bagger. Our latest stock picks just dropped:
- This technology could replace computers: discover 27 stocks that are working to make quantum computing a reality.
- We've uncovered the 12 dividend fortresses yielding 5%+ that don't just survive market storms, but thrive in them.
- The best AI stocks today may lie beyond giants like Nvidia and Microsoft. Find the next big opportunity with these 16 smaller AI-focused companies with strong growth potential through early-stage innovation in machine learning, automation, and data intelligence that could fund your retirement.
This article by Simply Wall St is general in nature. We provide commentary based on historical data and analyst forecasts only using an unbiased methodology and our articles are not intended to be financial advice. It does not constitute a recommendation to buy or sell any stock, and does not take account of your objectives, or your financial situation. We aim to bring you long-term focused analysis driven by fundamental data. Note that our analysis may not factor in the latest price-sensitive company announcements or qualitative material. Simply Wall St has no position in any stocks mentioned.