

The Bull Case For Newmont (NEM) Could Change Following Strong Q2 Earnings And Ongoing Buybacks
Newmont Corporation NEM | 0.00 |
- Newmont Corporation recently reported its second-quarter 2026 results, with attributable gold production of 1,293 koz, sales of US$6,118 million, net income of US$2,202 million, and a quarterly dividend of US$0.26 per share.
- The company paired higher quarterly and year-to-date earnings with continued share repurchases totaling US$3.00 billion since 2025, signaling an ongoing focus on returning capital to shareholders.
- We’ll now examine how Newmont’s stronger earnings alongside continued buybacks may influence its investment narrative and future risk‑reward balance.
The future of work is here. Discover the 34 top robotics and automation stocks leading the charge in AI-driven automation and industrial transformation.
Newmont Investment Narrative Recap
To own Newmont, you have to believe that its large, diversified gold portfolio can keep generating healthy cash flows even as key mines mature and costs rise. The latest quarter shows stronger earnings despite lower gold output, and continued buybacks, but does not materially change the near term focus on delivering stable production while managing higher sustaining and development capital spending as the most important near term risk.
The most relevant update here is Newmont’s completion of US$3,000 million in share repurchases since 2025. Against solid Q2 2026 earnings, this reinforces the current capital return story, but it also matters for the catalyst of future cash generation: once non core asset sales slow and capex rises, the ability to keep funding dividends and buybacks from ongoing operations becomes a more important test for the thesis.
But behind the stronger quarter, investors should be aware of how rising long term capex needs could affect...
Newmont's narrative projects $31.8 billion revenue and $13.3 billion earnings by 2029.
Uncover how Newmont's forecasts yield a $141.46 fair value, a 48% upside to its current price.
Exploring Other Perspectives
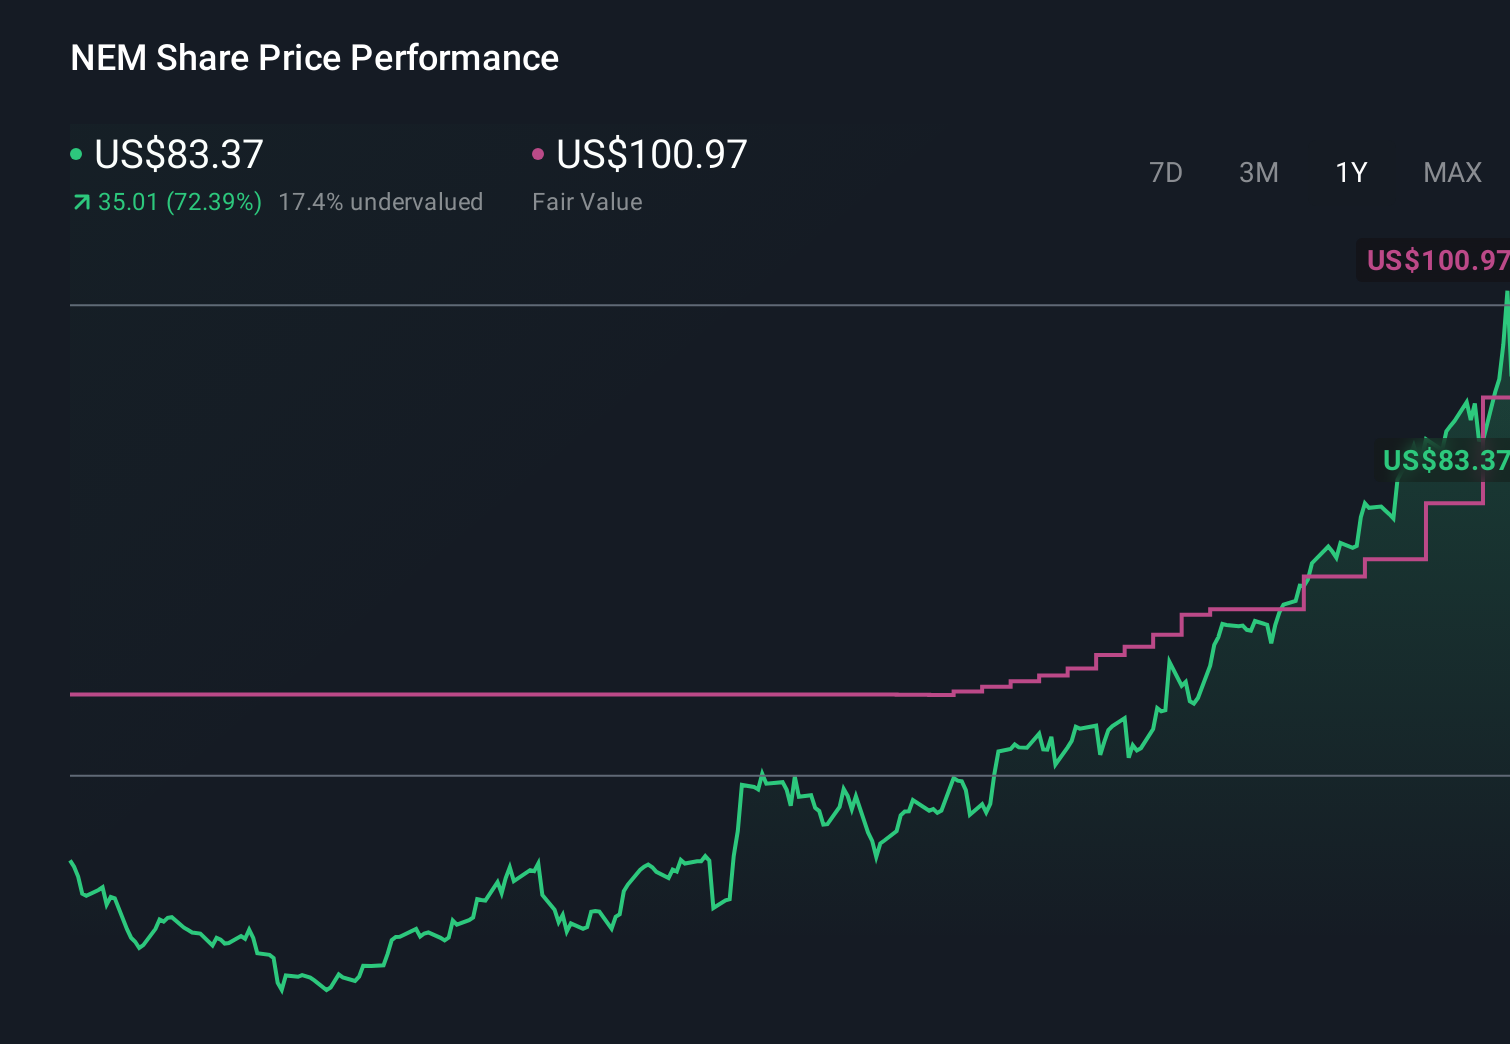
Some of the lowest ranked analysts were assuming revenues could fall about 5 percent a year to around US$22.1 billion by 2029, so if you think Q2’s stronger earnings and heavy buybacks challenge that view, it is worth asking whether higher costs and permitting risks might still justify their more pessimistic narrative.
Explore 11 other fair value estimates on Newmont - why the stock might be worth as much as 85% more than the current price!
The Verdict Is Yours
Don't just follow the ticker - dig into the data and build a conviction that's truly your own.
- A great starting point for your Newmont research is our analysis highlighting 4 key rewards that could impact your investment decision.
- Our free Newmont research report provides a comprehensive fundamental analysis summarized in a single visual - the Snowflake - making it easy to evaluate Newmont's overall financial health at a glance.
Interested In Other Possibilities?
Markets shift fast. These stocks won't stay hidden for long. Get the list while it matters:
- Rare earth metals are an input to most high-tech devices, military and defence systems and electric vehicles. The global race is on to secure supply of these critical minerals. Beat the pack to uncover the 29 best rare earth metal stocks of the very few that mine this essential strategic resource.
- This technology could replace computers: discover 26 stocks that are working to make quantum computing a reality.
- Uncover the next big thing with 21 elite penny stocks that balance risk and reward.
This article by Simply Wall St is general in nature. We provide commentary based on historical data and analyst forecasts only using an unbiased methodology and our articles are not intended to be financial advice. It does not constitute a recommendation to buy or sell any stock, and does not take account of your objectives, or your financial situation. We aim to bring you long-term focused analysis driven by fundamental data. Note that our analysis may not factor in the latest price-sensitive company announcements or qualitative material. Simply Wall St has no position in any stocks mentioned.