The Insider Report: Santa's Sleigh Broke Down, But…
ASE Technology Holding Co., Ltd. Sponsored ADR ASX | 22.28 | -0.89% |
Victoria's Secret & Company VSCO | 46.00 | -2.79% |
Market Overview
It's a new year and it's setting up to be the third consecutive dud for the classical Santa Claus rally period. The failure of this rally is sometimes ominous. The Nasdaq was down the most and finished 1.52% lower. The S&P 500 was down 1.03% while the Dow Jones Industrial Average was down 0.67%. Money is starting to circulate into defensive sectors so any new highs here without new, pro-growth leadership should be met with skepticism. Gold and silver finally pulled back and potentially peaked near-term. Crypto saw some bids later in the week too.
Stocks I Like
Victoria's Secret (NYSE:VSCO) – 50% Return Potential
What's Happening
- Victoria's Secret (VSCO) is a leading specialty retailer of women’s lingerie, apparel, and beauty products, operating iconic brands like Victoria’s Secret and PINK while expanding into accessible luxury and inclusive sizing, offering investors exposure to the rapidly growing intimate apparel and beauty sector with a focus on brand revitalization, digital innovation, and customer empowerment.
- The last quarter showed revenue of $1.47 billion but a loss of $21.57 million.
- This valuation on VSCO is slightly elevated with a P/E of 26.32, a Price-to-Sales of 0.72, and an EV to EBITDA of 13.26.
- From a technical standpoint, VSCO is flagging nicely within a bull flag formation. These are some of the most powerful patterns in all of technical analysis and often lead to explosive moves once resolved.
Why It's Happening
- Victoria’s Secret & Co. is experiencing a powerful brand revival, highlighted by the highly anticipated return of the Victoria’s Secret Fashion Show in 2025, which is driving significant consumer excitement and holiday momentum. This iconic event, combined with youth-focused marketing initiatives, is rekindling cultural relevance and boosting traffic across stores and digital channels in a competitive apparel landscape.
- Strong Q3 2025 earnings momentum underscores the company’s successful turnaround efforts, with net sales advancing 9% year-over-year alongside better-than-expected profitability from reduced promotions and full-price selling. This performance reflects stabilizing core categories and gaining traction in beauty and other franchises, creating a foundation for sustained comparable sales growth into 2026.
- Upgraded full-year guidance signals management confidence in ongoing recovery, with raised outlooks for earnings and operating income amid disciplined cost management and inventory controls. This positive revision highlights operational improvements that are translating into margin expansion and positioning the company to navigate macroeconomic pressures while capitalizing on seasonal demand.
- Strategic focus on omnichannel and customer engagement enhances Victoria’s Secret’s market resilience, blending physical retail experiences with robust e-commerce growth through targeted assortments and inclusive branding. This multi-channel approach is fostering deeper loyalty among diverse demographics, supporting long-term revenue diversification in the evolving retail sector.
- This is a strong candidate for a short squeeze with nearly 17% of floated shares being sold short.
- Analyst Ratings:
- Jeffries: Buy
- Telsey Advisory Group: Outperform
- Wells Fargo: Equal-Weight
My Action Plan (50% Return Potential)
- I am bullish on VSCO above $46.00-$47.00. My upside target is $80.00-$85.00.
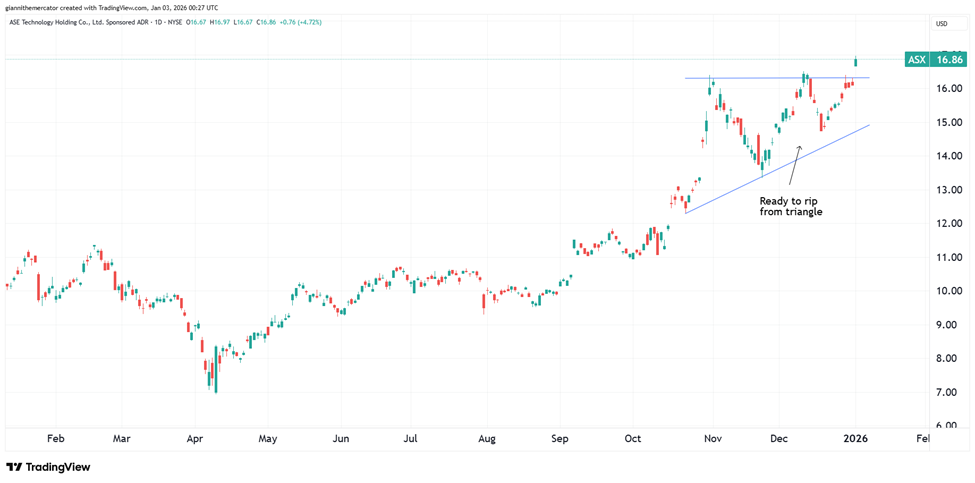
Ase Technology (NYSE:ASX) – 18% Return Potential
What's Happening
- ASE Technology Holding Co., Ltd. (ASX) is a leading global provider of semiconductor packaging and testing services, delivering advanced assembly, interconnect materials, and electronic manufacturing solutions for applications in computing, communications, automotive, and AI technologies, offering investors exposure to the rapidly growing semiconductor manufacturing and outsourcing sector with a focus on innovation and supply chain efficiency.
- The company had $168.57 billion in revenue in the last quarter along with $10.87 billion in earnings.
- Valuation is a bit high in ASX. P/E is at 32.66, Price-to-Sales is at 1.77, and EV to EBITDA is at 11.14.
- From a technical perspective, ASX is developing a triangle pattern, which often leads to a continuation in trend. The trend is very clearly up in this stock.
Why It's Happening
- ASE Technology Holding Co., Ltd. is dominating the semiconductor packaging and testing landscape, reporting robust monthly revenue growth throughout late 2025—including November revenues up 15.5% year-over-year to $1.9 billion—driven by surging demand in advanced testing and assembly for AI, automotive, and high-performance computing applications. This consistent outperformance positions ASE as a key beneficiary of the global chip shortage recovery and escalating electronics integration across industries.
- Explosive growth in advanced packaging fuels ASE’s long-term expansion story. The company’s LEAP (leading edge advanced packaging) segment is projected to scale dramatically, contributing significantly to overall margins and tapping into the booming heterogeneous integration market essential for next-gen AI accelerators and 5G/6G infrastructure, creating a high-margin revenue engine in a sector experiencing structural tailwinds.
- Diversified end-market exposure enhances ASE’s resilience and upside potential. Serving computing, communications, industrial, automotive, and server clients worldwide, the company benefits from broad-based recovery in consumer electronics, electric vehicles, and data centers—insulating it from single-sector volatility while capturing value from the ongoing digital transformation across emerging and developed economies.
- Improving gross margins and operational scale underscore ASE’s path to enhanced profitability. With IC ATM margins expected to expand amid higher utilization rates and premium pricing for advanced services, ASE is leveraging its Taiwan-based manufacturing leadership to deliver cost efficiencies and stronger earnings conversion in a capital-intensive industry.
- Analyst Ratings:
- UBS: Buy
- Goldman Sachs: Buy
My Action Plan (18% Return Potential)
- I am bullish on ASX above $13.50-$14.00. My upside target is $20.00-$21.00.
Market-Moving Catalysts for the Week Ahead
As Goes January, As Goes the Year?
The January Barometer, popularized by the Stock Trader’s Almanac as the adage “as goes January, so goes the year,” posits that the S&P 500’s performance in January predicts the direction of the full-year returns.
Since 1950, this indicator has been accurate about 75-84% of the time, with positive January months often leading to annual gains averaging around 16-17%, while negative ones correlate with flat or down years.
Often linked to the separate January Effect—a seasonal tendency for stocks (especially small-caps) to rise in January due to tax-loss harvesting and bonus reinvestments—the barometer’s predictive power has weakened in recent decades amid efficient markets and dominant macroeconomic drivers. However, it remains a watched seasonal pattern, though not a reliable standalone trading strategy. Let's see if stocks can overcome their near-term jitters and start 2026 off on the right foot.
Sector & Industry Strength

The sector performance rankings haven't stirred the pot all that much as we come out of the holiday trading season. Healthcare (XLV) was the clear winner in the fourth quarter, and so it's not much of a surprise that the equity indices have been sideways for the past three months.
Other defensive sectors like staples (XLP) and utilities (XLU) woefully underperformed in the fourth quarter as well. It's a big reason why the market has been correcting through time instead of price recently.
Technology (XLK) is looking to come back alive here in 2026 after not doing much in the fourth quarter. Basic materials (XLB) have capitalized on the rally in miners, while financials (XLF) continue to benefit from the steepening yield curve.
| 1 week | 3 Weeks | 13 Weeks | 26 Weeks |
| Energy | Basic Materials | Healthcare | Healthcare |
Editor's Note: The internals are cooling. It's worth keeping in mind if stocks hit a new all-time high soon.
The Most Important Ratio in 2026 (Sector ETF: SMH/QQQ)
There are dozens upon dozens of ratios to monitor closely, but given the stock market environment we're in now, the ratio between semiconductors (SMH) and the Nasdaq 100 (QQQ) remains the most important one for stocks in 2026.
This is the ratio that has been driving the AI theme of this bull market. As long as chips (SMH) continue to outperform the Nasdaq 100 (QQQ), this bull market can easily continue. There will be bumps along away, to be sure, but they're dip buying opportunities if anything.
The breakout from the wedge formation earlier in 2025 actually suggests that the outperformance momentum can even accelerate in 2026. If there's a dip in Q1, it could set up a slingshot market by which tech carries the load even more.
Cryptocurrency
2025 was one of the worst years for cryptocurrency performance in recent history. If anything, this is providing a backdrop for 2026 to be a tremendous year for a rebound in this asset class, especially in the back-half of the year.

We're back to looking at Ethereum here, which remains stuck below resistance at 3200-3300, but above technical support at 2600-2800. The concern near-term is that it's consolidating its losses, which leaves the door open for a final flush lower.
In that scenario, a drop to 2100-2200 could still play out. But if Ethereum can climb back above 3200-3300, we would have to start considering that the bottom is complete. However, it would still take a rally back above the November 10 high at 3658 to confirm the bear market is over.
Legal Disclosures:
This communication is provided for information purposes only.
This communication has been prepared based upon information, including market prices, data and other information, from sources believed to be reliable, but Benzinga does not warrant its completeness or accuracy except with respect to any disclosures relative to Benzinga and/or its affiliates and an analyst’s involvement with any company (or security, other financial product or other asset class) that may be the subject of this communication. Any opinions and estimates constitute our judgment as of the date of this material and are subject to change without notice. Past performance is not indicative of future results. This communication is not intended as an offer or solicitation for the purchase or sale of any financial instrument. Benzinga does not provide individually tailored investment advice. Any opinions and recommendations herein do not take into account individual client circumstances, objectives, or needs and are not intended as recommendations of particular securities, financial instruments or strategies to particular clients. You must make your own independent decisions regarding any securities, financial instruments or strategies mentioned or related to the information herein. Periodic updates may be provided on companies, issuers or industries based on specific developments or announcements, market conditions or any other publicly available information. However, Benzinga may be restricted from updating information contained in this communication for regulatory or other reasons. Clients should contact analysts and execute transactions through a Benzinga subsidiary or affiliate in their home jurisdiction unless governing law permits otherwise.
This communication may not be redistributed or retransmitted, in whole or in part, or in any form or manner, without the express written consent of Benzinga. Any unauthorized use or disclosure is prohibited. Receipt and review of this information constitutes your agreement not to redistribute or retransmit the contents and information contained in this communication without first obtaining express permission from an authorized officer of Benzinga. Copyright 2022 Benzinga. All rights reserved.