The Trend Catcher | CRWV (+8%), NBIS (+7%) Lead Internet-Network Services Sector; SNDK Hits ATH, 2x Leveraged ETF Gains 10%; AMD and INTC Up Over 5%, Near Breakouts.
CoreWeave CRWV | 0.00 | |
WhiteFiber WYFI | 0.00 | |
NEBIUS NBIS | 0.00 | |
Bridgeline Digital, Inc. BLIN | 0.00 | |
Lam Research Corporation LRCX | 0.00 |
Subscribe to "The Trend Catcher Topic," tracking hottest sectors & technical breakouts in real time daily, accompanying you every US stock trading day.
1. Leader industry as of 5:38 pm
| Name | Price % Chg | Ind Group Rank | Ind Grp Rnk Last Week | Ind Grp Rnk 3 Mo Ago | Number of Stocks | % Chg YTD | Ind Mkt Val (bil) |
|---|---|---|---|---|---|---|---|
| Internet-Network Sitns | 4.77 | 32 | 16 | 58 | 17 | 32.0 | 126.9 |
| Oil&Gas-Royalty Trust | 2.59 | 102 | 62 | 1 | 14 | 32.4 | 29.4 |
| Finance-Invest Bnk/Bkrs | 2.40 | 110 | 111 | 130 | 37 | -9.2 | 518.5 |
| Finance - Crypto/Blockchain | 2.54 | 83 | 66 | 122 | 78 | 12.3 | 222.2 |
| Bldg-Heavy Construction | 2.15 | 29 | 26 | 30 | 36 | 37.1 | 392.1 |
Internet-Network Sitns Related Stocks: CoreWeave(CRWV.US), WhiteFiber(WYFI.US), NEBIUS(NBIS.US), Bridgeline Digital, Inc.(BLIN.US).
Daily US Equity Brief: The AI Theme Under "Stress Test": A Tale of Two Markets – Defense & Hardware Surge as Tech Cools
Core Thesis: Yesterday's (June 11) U.S. market saw a dramatic divergence. While the long-term narrative for AI infrastructure remains intact, the short-term market has entered a phase of "separating the wheat from the chaff." Capital rotated out of crowded AI momentum plays into "picks-and-shovels" plays (equipment, memory, copper interconnects) and defensive sectors, signaling a shift from "trend-driven" speculation to "earnings validation."
1. Semiconductors & AI Hardware: Divergence Intensifies, the "Picks-and-Shovels" Thesis Strengthens
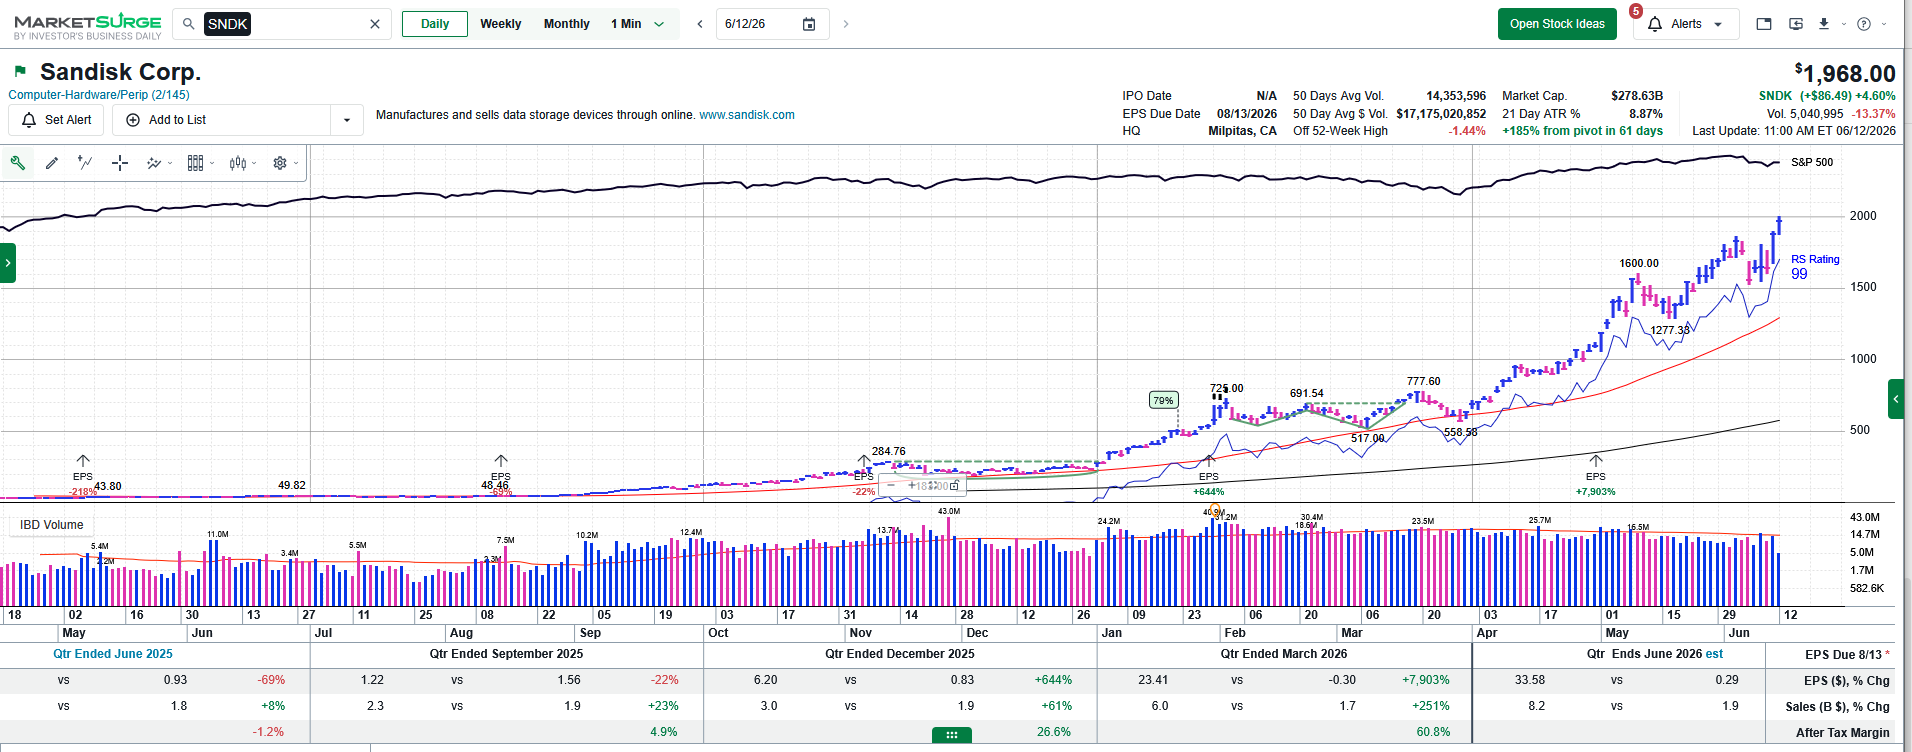
The semiconductor sector led the market, but the divergence was stark. WFE (wafer fab equipment) stocks were the clear winners, with Lam Research Corporation(LRCX.US), Applied Materials, Inc.(AMAT.US), and ASML Holding NV ADR(ASML.US) surging ~10% as multiple institutions raised their 2026-2028 WEF market size outlook. Memory was also strong, with Sandisk Corporation(SNDK.US) surging 15% to a new high; Morgan Stanley believes the current price adjustment is a healthy correction for a prolonged cycle. Copper interconnects (Credo Technology(CRDO.US), Astera Labs(ALAB.US)) also posted record highs. Conversely, previously crowded AI momentum plays faced selling pressure, as the market reassessed valuation pressures on names like Nvidia.
2. Cloud Infrastructure & Oracle: The "Soul-Searching" Between Orders and Cash Flow
Oracle's earnings report was the focal point. The good news: Cloud IaaS revenue grew 93%, and Remaining Performance Obligations (RPO) skyrocketed to $638 billion, confirming explosively robust demand for AI computing power. **The bad news:** The nearly $100 billion FY27 capex guidance raised concerns about its transformation into a "capital-intensive GPU landlord," pressuring gross margins and free cash flow, leading to a 8.5% decline in its stock price.
3. Capital Flows: Record Tech Outflows Meet Defensive Rotation
BofA data showed that the tech sector experienced its largest institutional outflow since 2008. Capital is not leaving the market; instead, it is rotating into ETFs, healthcare, consumer staples, regional banks, and other defensive and lagging sectors. This indicates the market is "paying tuition" for its prior extreme concentration in big-cap tech.
4. Macro & Geopolitics: Catalysts for Rising Volatility
While the core CPI came in slightly below expectations, oil prices remained elevated above $90 per barrel due to geopolitical tensions (U.S.-Iran standoff, Strait of Hormuz risks), continuing to pressure high-valuation tech stocks. Goldman Sachs warned that CTA strategies have turned fully bearish, market liquidity is nearly exhausted, and the near-term margin for error is extremely low, with any unexpected event potentially amplifying the sell-off.
Summary: Yesterday's market can be defined as a "healthy stress test for the AI theme." One should remain bullish on the structural long-term trend (equipment, memory, power), but must be vigilant about the potential reversal of crowded trades and the need for individual companies to validate their cash flow. The market is increasingly rewarding "doers" who can convert AI orders into profit and cash flow (like equipment and memory stocks), rather than mere "story beneficiaries."
2. Breaking Out Today as of 5:48 pm
| Symbol | Comp Rating | Industry Name | Current Price | Price % Chg | Volume (1000s) | Price $ Chg | EPS Rating | RS Rating | Ind Group RS | SMR Rating | A/D Rating | Market Cap (mil) |
|---|---|---|---|---|---|---|---|---|---|---|---|---|
| Sandisk Corporation(SNDK.US) | 91 | Computer-Hardware/Perip | 1,974.69 | 4.95 | 4,825 | 93.18 | 72 | 99 | A+ | C | D- | 278,632.3 |
Related ETF: Tradr 2X Long SNDK Daily ETF(SNXX.US) T-REX 2X Long SNDK Daily Target ETF(SNDU.US).
3. Near Breakouts as of 5:48 pm
| Symbol | Comp Rating | Industry Name | Current Price | Price % Chg | Volume (1000s) | Price $ Chg | EPS Rating | RS Rating | Ind Group RS | SMR Rating | A/D Rating | Market Cap (mil) |
|---|---|---|---|---|---|---|---|---|---|---|---|---|
| Advanced Micro Devices, Inc.(AMD.US) | 99 | Elec-Semiconductor Fabless | 513.66 | 5.16 | 12,347 | 25.21 | 95 | 98 | A | A | B | 796,466.9 |
| Intel Corporation(INTC.US) | 87 | Elec-Semiconductor Mfg | 122.81 | 5.00 | 52,003 | 5.85 | 60 | 99 | A+ | D | B- | 587,841.0 |
| U.S. Bancorp(USB.US) | 87 | Banks-Super Regional | 59.11 | 2.57 | 2,822 | 1.48 | 82 | 70 | B+ | C | C | 89,459.0 |
| PNC Financial Services Group, Inc.(PNC.US) | 91 | Banks-Super Regional | 237.88 | 1.68 | 251 | 3.94 | 76 | 73 | B+ | B | B | 93,942.0 |
Subscribe to The Trend Catcher Topic / The Value Anchor Topic —unlock the full historical archive and never miss a weekly pick again.
Stocks In Focus:
| Company Fundamentals | Details |
|---|---|
| EPS Due Date | 8/13/2026 |
| EPS % Chg (Last Qtr) | 7903% |
| 3 Year EPS Growth Rate | 0% |
| EPS Est % Chg (Current Yr) | 11481% |
| Annual ROE | 39% |
| Sales % Chg (Last Qtr) | 251% |
| 3-Year Sales Growth Rate | 0% |
| Debt % | 0 |
| Market Cap | $279 Bil |
| Annual Pre-Tax Margin | 69.03% |
| Sector | Computer |
| Industry Group | Computer-Hardware/Perip |
| Industry Group Rank | 2 |
More of Our Investment Philosophy>>
Disclaimer: The content is provided as general information only and should not be taken as investment advice. All the contents shall not be taken as a recommendation to buy or sell any security or financial instruments. Any action you take resulting from information, analysis, or commentary on this article is your responsibility. Please consult your investment advisor before making any investments.