

The Trend Catcher | Last Week's Pick PANW Gains 4.63%, AAPL Hits New Highs Lifting Consumer Prods; Comml Svcs-Staffing Holds 1st — Don't Miss Next Week's Top Movers
Apple Inc. AAPL | 0.00 | |
Palo Alto Networks, Inc. PANW | 0.00 | |
SharkNinja SN | 0.00 | |
RECRUIT HOLDINGS CO LTD RCRUY | 0.00 | |
First Advantage Corp. FA | 0.00 |
Finding the strongest stocks inside the strongest sectors—so you can ride the market’s clearest trends.
Subscribe to The Trend Catcher Topic / The Value Anchor Topic —unlock the full historical archive and never miss a weekly pick again.
Top 5 Gainers of This Week Last Week's Review>>
| Name | 5-Day Price Change(%) |
|---|---|
| Palo Alto Networks, Inc.(PANW.US) | 4.63% |
| SharkNinja(SN.US) | 3.63% |
1. Heating-Up Industries & Logic
Institutional insights on the popular sectors of the listed stocks. Data source from professional institutional reports.
Sorted by "Ind Group Rank"
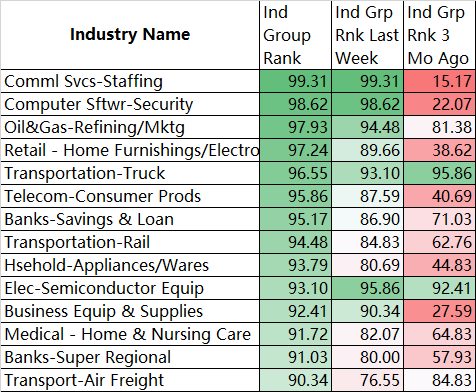
Comml Svcs-Staffing (Top RS+EPS Stocks): RECRUIT HOLDINGS CO LTD(RCRUY.US) , First Advantage Corp.(FA.US) , ManpowerGroup Inc.(MAN.US) , AMN Healthcare Services, Inc.(AMN.US) , Korn Ferry(KFY.US) , Kelly Services, Inc. Class A(KELYA.US)
Comml Svcs-Staffing Core Logic & Market Space
- AI disruption to traditional profit pools: Goldman Sachs believes AI is reallocating enterprise spend from human-driven intermediation toward technology platforms. AI-driven hiring demand compression exposes approximately $10 billion in temp, $41 billion in perm, and $12 billion in freelance profit pools, reflecting lower labor volume and hiring activity.
- New monetization opportunities: As spend shifts from discovery toward matching, verification, and hiring outcomes, a ~$38 billion recruiter workflow opportunity and a ~$17 billion online marketplace opportunity emerge.
- Value migration: Value accrues to workflow platforms, scaled marketplaces, technology layers, and defensible advisory models, while volume-driven traditional staffing comes under pressure.
- AI‑related staffing TAM: The current AI‑related staffing TAM is estimated at ~$2–12 billion (mid‑case ~$6 billion), with a ~28% salary premium for AI skills supporting higher staffing monetization.
Market Dynamics
- AI adoption among knowledge workers is broad, with ~75% using AI tools regularly, but AI remains primarily assistive rather than fully substitutive, with most workflows still requiring oversight, validation, compliance, and client interaction.
- Within staffing, AI adoption is concentrated in high‑volume, standardized, and repeatable recruiting execution stages.
- RPO (Recruitment Process Outsourcing) is estimated at ~$6 billion (2027E), growing at a mid‑teens CAGR, serving as a leading indicator for AI‑driven disruption.
2. Top Stock Picks This Week
Our Stock Selection Criteria & Indicator Guide: Click for Details >>
| Symbol | Current Price | Industry Name | Ind Group Rank | Market Cap (mil) | Comp Rating |
| Fortinet, Inc.(FTNT.US) | 160.78 | Computer Sftwr-Security | 2 | 120,528 | 99 |
| Okta(OKTA.US) | 147.74 | Computer Sftwr-Security | 2 | 26,220.6 | 99 |
| Palo Alto Networks, Inc.(PANW.US) | 353.99 | Computer Sftwr-Security | 2 | 288,526.3 | 99 |
Analysis of Apple Inc.(AAPL.US)
1. Financial & Earnings Outlook
Morgan Stanley believes Apple’s strategy of “raising prices to protect margins” could lead to a 2-4% upside to F3Q26 EPS and ~1% upside to FY27 EPS; its FY27 revenue model is $557.5B with EPS of $10.30, well above consensus ($520.5B / $9.72). Bernstein expects FY27 EPS of $10.65 and assigns a $350 price target. Gross margin is projected around 47.5% with operating margin near 31.8%.
2. Product & AI Strategy
Morgan Stanley maintains its Overweight thesis, seeing a long-term AI-driven replacement cycle (Apple Intelligence & Siri improving) and a stronger near-term roadmap (first Foldable, iPhone Air 2, 20th-anniversary iPhone) supporting healthy growth. Citi reiterates Buy, noting that despite a slowing device market, Apple’s pricing power and loyal base lift share; selective price hikes offset cost pressures, enhanced Siri aids services revenue, and the September iPhone launch is a catalyst.
3. Hardware vs. Services Divergence
KeyBanc downgraded AAPL to Underweight (PT $250), citing June hardware spend -2% m/m, slowing iPhone builds, weaker U.S. upgrades as subsidies fade, and lower ’27 Mac/iPad/Wearables estimates; it sees FY27 services growth decelerating to 7% (vs. ~12% consensus) on user-base pressure. In contrast, Morgan Stanley and Citi view services re-acceleration as a key positive driver.
4. Supply Chain & Costs
TSMC docs show Apple is a lead customer for 2nm/3nm; separate sources confirm Apple as an Intel 18A Foundry client. Amid memory price hikes, KeyBanc warns 2027 smartphone memory allocation may drop 20% to prioritize data centers, but Apple’s pricing power mitigates cost pass-through.
5. Share, Capital Return & Events
Data shows Apple’s Q2 global shipments +3% YoY, reaching 20% share for the first time; premium demand is more resilient, yet its valuation premium vs. S&P 500 is ~65%, requiring autumn AI delivery. Korean research notes buybacks & dividends drove ~70% of excess returns in 2013-25. Apple also sued OpenAI for trade-secret theft, adding legal uncertainty.
6. Institutional Views
- Morgan Stanley: Overweight, PT $360 (35x FY27 P/E)
- Citi: Buy, PT $365
- Bernstein: Overweight, PT $350
- KeyBanc: Underweight, PT $250 (27.5x P/E, deemed expensive)
Risk Factors: Rich valuation hinges on AI/new-product execution; services slowdown or hardware weakness; supply-chain cost and geopolitical constraints.
| Symbol | Current Price | Industry Name | Ind Group Rank | Market Cap (mil) | Comp Rating |
| Apple Inc.(AAPL.US) | 333.26 | Telecom-Consumer Prods | 6 | 4,810,109.2 | 99 |
| CSX Corporation(CSX.US) | 50.89 | Transportation-Rail | 8 | 91,847.8 | 91 |
| SharkNinja(SN.US) | 154.21 | Hsehold-Appliances/Wares | 9 | 21,235.1 | 99 |
| Northern Trust Corporation(NTRS.US) | 188.52 | Banks-Super Regional | 13 | 35,367.2 | 97 |
| Concentra Group Holdings Parent, Inc.(CON.US) | 31.64 | Medical-Managed Care | 15 | 3,910.5 | 93 |
| Veracyte, Inc.(VCYT.US) | 59.22 | Medical-Services | 18 | 4,748.5 | 98 |
| Bank of New York Mellon Corp(BNY.US) | 160.86 | Banks-Money Center | 20 | 111,433.6 | 99 |
| Mitsubishi UFJ Financial Group, Inc. Sponsored ADR(MUFG.US) | 22.13 | Banks-Money Center | 20 | 254,971.8 | 98 |
| Royal Bank of Canada(RY.US) | 216.07 | Banks-Money Center | 20 | 302,395.1 | 99 |
| Sumitomo Mitsui Financial Group Inc Sponsored ADR(SMFG.US) | 25.85 | Banks-Money Center | 20 | 167,635 | 99 |
| Monster Beverage Corporation(MNST.US) | 99.94 | Beverages-Non-Alcoholic | 23 | 95,424.3 | 99 |
| Targa Resources Corp.(TRGP.US) | 280.27 | Oil&Gas - Pipeline | 34 | 59,705.3 | 98 |
| YETI Holdings(YETI.US) | 51.06 | Leisure-Products | 38 | 3,661.4 | 87 |
| CoreCivic, Inc.(CXW.US) | 30.65 | Security/Sfty | 40 | 3,074.4 | 97 |
| The GEO Group(GEO.US) | 29.62 | Security/Sfty | 40 | 3,984.5 | 94 |
Screening Philosophy: based on ratings of financial data, stock relative price strength, and industry sector effects to screen for and capture opportunities in the currently hottest market sectors and strongest individual stocks;
Filters Applied: Comp Rating ≥85; RS Rating ≥85; Ind Group RS: A; SMR Rating: A,B; Price ≥$20; Vol. ≥1000k; Market Cap. ≥3B; Sorted by Ind Group Rank;
Stock Selection Period: as of Friday;
About 'The Trend Catcher' Column:
Finding the strongest stocks inside the strongest sectors—so you can ride the market’s clearest trends.
We combine quantitative relative strength screens with real-time thematic analysis to highlight capital’s favorite directions.
All views are sourced from public market data and institutional research, for informational purposes only and not personalized investment advice.
Tune in to today’s dominant momentum.Subscribe to The Trend Catcher Topic — unlock the full historical archive and never miss a weekly pick again.
Disclaimer: The content is provided as general information only and should not be taken as investment advice. All the contents shall not be taken as a recommendation to buy or sell any security or financial instruments. Any action you take resulting from information, analysis, or commentary on this article is your responsibility. Please consult your investment advisor before making any investments.