The Trend Catcher | Mining-Gold/Silver/Gems Industry Leads; GPOR, EQIX, AL and COST Keep Trying to Break Out, SLAB Near Breakout
Air Lease Corporation Class A AL | 0.00 | |
Silicon Laboratories Inc. SLAB | 0.00 | |
GULFPORT ENERGY CORP GPOR | 0.00 | |
Equinix, Inc. EQIX | 0.00 | |
Costco Wholesale Corporation COST | 0.00 |
Tracking Hottest Sectors & Technical Breakouts in Real Time Daily
1. Leader industry as of 6:08 pm
| Name | Price % Chg | Number of Stocks | Ind Group RS | Ind Group Rank | % Chg YTD | Ind Mkt Val (bil) |
|---|---|---|---|---|---|---|
| Mining-Gold/Silver/Gems | 3.2 | 78 | A | 21 | 7.65 | 734.0 |
| Retail-Mail Order&Direct | 3.1 | 3 | E | 194 | -56.89 | 0.0 |
| Computer Sftwr-Edu/Media | 2.9 | 17 | E | 191 | -39.14 | 105.0 |
| Mining-Metal Ores | 2.7 | 58 | A- | 44 | 4.35 | 635.0 |
| Auto/Truck-Replace Parts | 2.6 | 7 | E | 187 | -13.29 | 5.0 |
2. Near Breakouts as of 6:08 pm
| Name | Price % Chg | Price $ Chg | EPS Rating | RS Rating | Ind Group RS | SMR Rating | A/D Rating | Comp Rating |
|---|---|---|---|---|---|---|---|---|
| Air Lease Corporation Class A(AL.US) | 0.3 | 0.18 | 99 | 79 | D- | A | D | 88 |
| Silicon Laboratories Inc.(SLAB.US) | 0.8 | 1.56 | 79 | 96 | B- | C | B- | 97 |
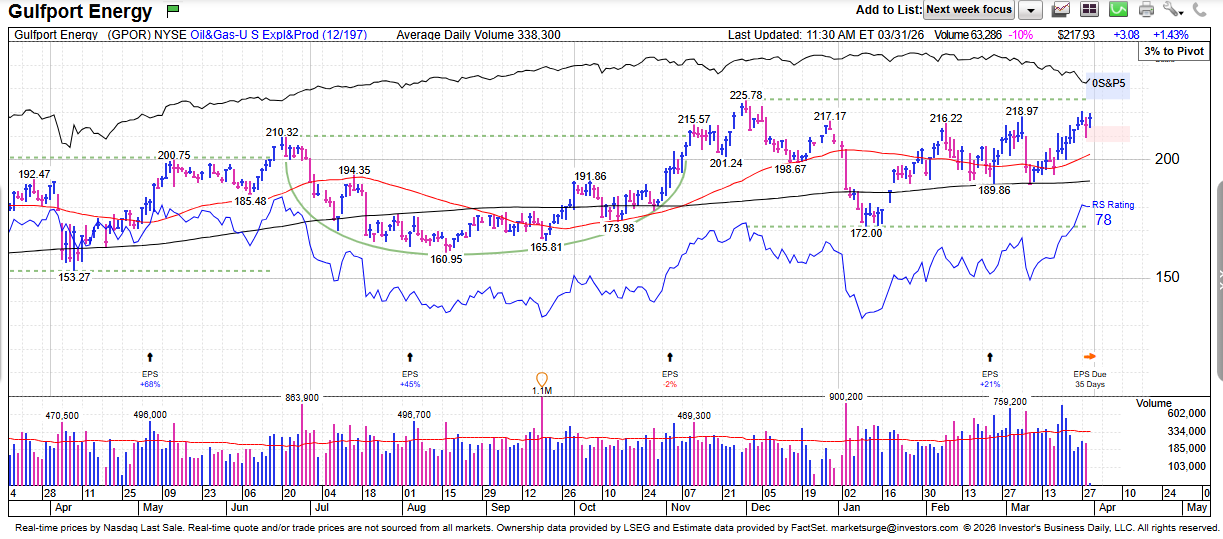
| GULFPORT ENERGY CORP(GPOR.US) | 1.4 | 2.99 | 62 | 78 | A+ | A | B- | 95 |
| Equinix, Inc.(EQIX.US) | 0.5 | 4.44 | 98 | 88 | B | C | B+ | 95 |
| Costco Wholesale Corporation(COST.US) | -0.2 | -1.77 | 89 | 78 | A- | A | A | 95 |
Notably, Costco Wholesale Corporation(COST.US), GULFPORT ENERGY CORP(GPOR.US), Equinix, Inc.(EQIX.US) is attempting a breakout on the fourth day, while Air Lease Corporation Class A(AL.US) is attempting a breakout on the second day.
Chemicals-Agricultural Sector: A technical bounce + safe-haven flows + positioning unwind drove the outperformance.
Logic:
- Precious metals rebound from oversold levels: Gold and silver both bounced ~1% intraday after a steep March sell-off (gold down ~13% for the month). This kind of technical rebound tends to drive an amplified move in mining equities, which are highly leveraged to underlying metal prices.
- Safe-haven demand re-emerging amid geopolitical risk: Ongoing U.S.–Iran conflict and oil shock are keeping macro uncertainty elevated, reviving safe-haven flows into gold despite rate concerns. Even a modest pickup in gold demand can quickly lift sentiment toward miners.
- Positioning squeeze after heavy underperformance: Gold and mining stocks had been heavily sold throughout March due to higher rates and a stronger dollar. As a result, today’s move is partly a short-covering + mean-reversion rally, rather than a full fundamental trend shift.
Related Stocks Chart
Related Fundamentals
| Metric | Value |
|---|---|
| EPS Due Date | 5/5/2026 |
| EPS % Chg (Last Qtr) | 21% |
| 3 Year EPS Growth Rate | 17% |
| EPS Est % Chg (Current Yr) | 22% |
| Annual ROE | 23% |
| Sales % Chg (Last Qtr) | 66% |
| 3-Year Sales Growth Rate | -19% |
| Debt % | 43% |
| Market Cap | $4 Bil |
| Annual Pre - Tax Margin | 40.2% |
| Sector | Energy |
| Industry Group | Oil&Gas-U S Expl&Prod |
| Industry Group Rank | 12 |
More of Our Investment Philosophy>>
Disclaimer: The content is provided as general information only and should not be taken as investment advice. All the contents shall not be taken as a recommendation to buy or sell any security or financial instruments. Any action you take resulting from information, analysis, or commentary on this article is your responsibility. Please consult your investment advisor before making any investments.