The Trend Catcher | Telecom Infrastructure Ranks No.1; NBIS, FFIV Lead Network Rally; VCYT (+4.6%) Breaks Out While HWM and RBC Near Buy Points
Dycom Industries, Inc. DY | 0.00 | |
Nokia Oyj Sponsored ADR NOK | 0.00 | |
ViaSat, Inc. VSAT | 0.00 | |
UBIQUITI INC UI | 0.00 | |
Ribbon Communications, Inc. RBBN | 0.00 |
Equipment Subscribe to "The Trend Catcher Topic," tracking hottest sectors & technical breakouts in real time daily, accompanying you every US stock trading day.
1. Leader industry as of 5:57 pm
| Name | Price % Chg | Ind Group Rank | Ind Grp Rnk Last Week | Ind Grp Rnk 3 Mo Ago | Number of Stocks | % Chg YTD | Ind Mkt Val (bil) |
| Telecom-Infrastructure | 6.58 | 3 | 23 | 5 | 22 | 106 | 1,631.80 |
| Internet-Network Sltns | 3.67 | 8 | 33 | 64 | 17 | 48.7 | 140.5 |
| Retail-Leisure Products | 2.93 | 123 | 119 | 131 | 14 | 0.1 | 31.3 |
| Finance-Commercial Loans | 2.77 | 133 | 118 | 130 | 9 | -9.2 | 5.7 |
| Medical - Home & Nursing Care | 2.3 | 110 | 124 | 15 | 9 | 3.1 | 27.2 |
Telecom-Infrastructure Related Stocks: Dycom Industries, Inc.(DY.US), Nokia Oyj Sponsored ADR(NOK.US), ViaSat, Inc.(VSAT.US), UBIQUITI INC(UI.US), Ribbon Communications, Inc.(RBBN.US).
Internet-Network Sltns Related Stocks: F5, Inc.(FFIV.US), Crexendo, Inc.(CXDO.US), A10 Networks, Inc.(ATEN.US), RADCOM Ltd.(RDCM.US), NEBIUS(NBIS.US).
Daily US Equity Brief: Risk-On Returns – AI Leads as Oil Collapse Fuels Broad Market Rally
Core Thesis:
Yesterday's (June 15) U.S. market was dominated by a sharp resurgence in risk appetite. A preliminary U.S.-Iran agreement and prospects for reopening the Strait of Hormuz triggered a nearly 5% drop in oil prices, easing inflation concerns and driving one of the strongest rallies in months. AI, semiconductors, and growth stocks led the advance, while energy stocks became the biggest losers. The market narrative shifted from geopolitical risk and inflation fears back toward AI growth and economic expansion.
1. AI & Semiconductors: Risk Appetite Returns
Technology stocks staged a powerful rebound, with the Nasdaq surging more than 3%, its strongest session since March. AI-related names, including semiconductors, memory, and infrastructure providers, attracted significant inflows as investors rotated back into growth. NVIDIA Corporation(NVDA.US), MICRON SOLUTIONS INC(MICR.US), Advanced Micro Devices, Inc.(AMD.US), Marvell Technology(MRVL.US), and other AI supply-chain beneficiaries outperformed amid renewed confidence in data center spending and AI demand.
The market once again favored companies directly monetizing AI infrastructure rather than speculative AI application stories.
2. Macro Turns from Headwind to Tailwind
The biggest catalyst was the collapse in oil prices.
Brent crude fell nearly 5% after the U.S. and Iran reached a preliminary framework agreement, significantly reducing concerns about disruptions in Middle East energy supplies. Lower oil prices immediately eased inflation expectations, pushed Treasury yields lower, and improved sentiment toward long-duration growth assets.
For investors, this represented a reversal of the inflation shock that had pressured equities in recent weeks.
3. Winners and Losers: Airlines Up, Energy Down
The sharp decline in crude oil created a clear sector rotation.
Winners:
- Airlines
- Travel companies
- Consumer cyclicals
- Technology and AI stocks
Losers:
- Oil producers
- Energy services companies
- Defensive commodity plays
Airline stocks surged as lower fuel costs improved earnings outlooks, while energy shares sold off as geopolitical risk premiums evaporated.
4. SpaceX Continues to Drive Growth Sentiment
Following its blockbuster IPO debut, SpaceX(SPCX.US) remained a major source of market enthusiasm.
The stock extended its rally, reinforcing investor appetite for innovation-driven themes including aerospace, satellite communications, AI infrastructure, and advanced manufacturing. The success of SpaceX has become a broader confidence signal for high-growth sectors and capital-intensive technology investments.
Summary: The Market's Focus Shifts Back to Growth
June 15 can be characterized as a "Risk-On Repricing Day."
The market largely looked past recent geopolitical tensions and refocused on falling inflation risks, lower energy costs, and AI-driven growth opportunities. Semiconductors and AI infrastructure resumed leadership, while energy stocks surrendered much of the fear premium accumulated over recent weeks.
Key takeaway:
The AI bull thesis remains intact, but its biggest ally may no longer be AI itself—it may be falling oil prices and easing inflation, which are restoring investors' willingness to pay for future growth.
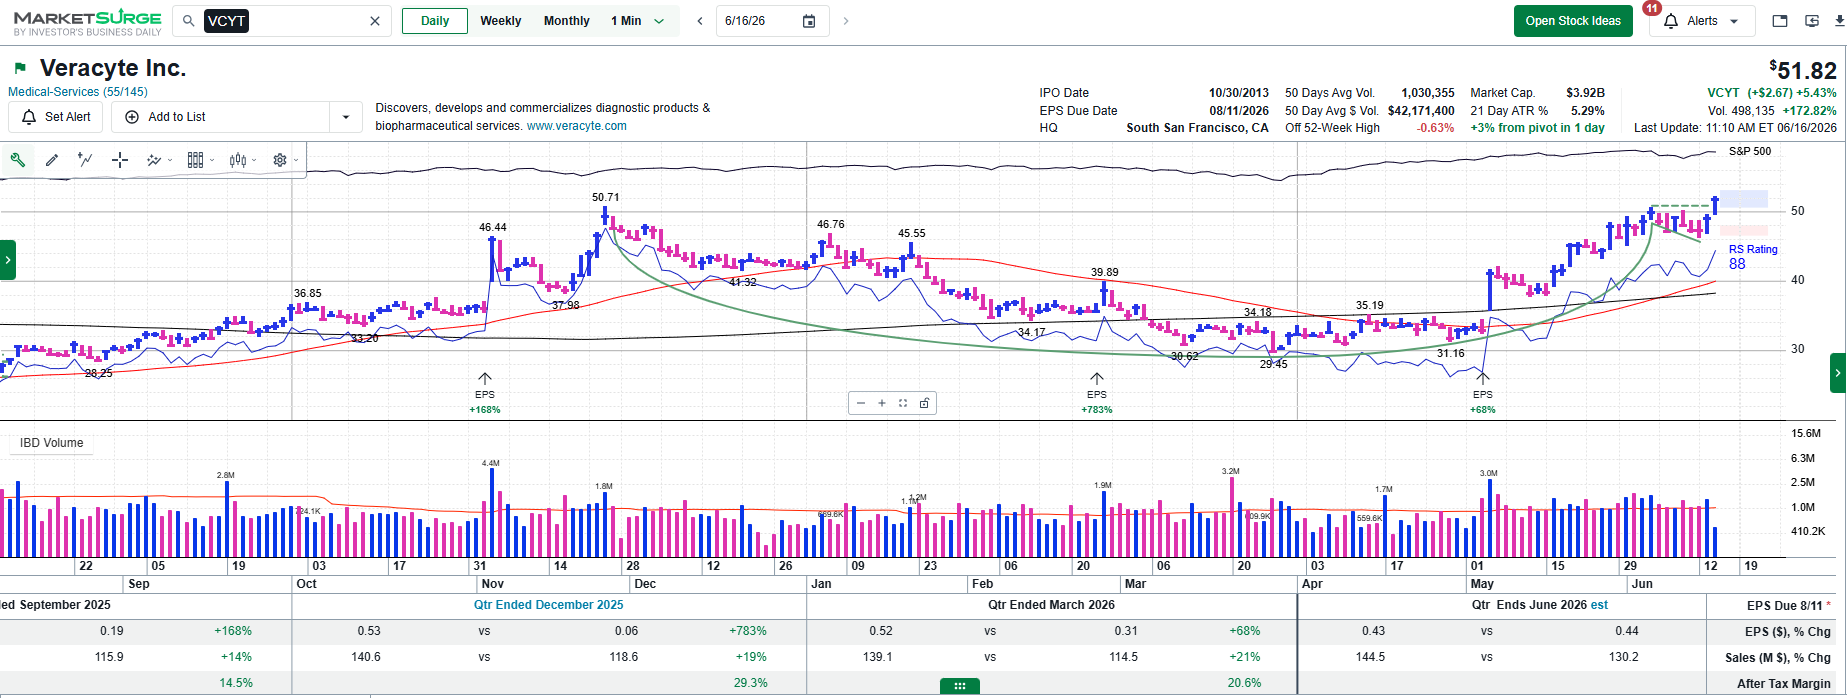
2. Breaking Out Today as of 5:57 pm
| Symbol | Comp Rating | Industry Name | Current Price | Price % Chg | Volume (1000s) | Price $ Chg | EPS Rating | RS Rating | Ind Group RS | SMR Rating | A/D Rating | Market Cap (mil) |
| Veracyte, Inc.(VCYT.US) | 97 | Medical-Services | 51.41 | 4.6 | 453 | 2.26 | 76 | 88 | B | B | A+ | 3,921.80 |
3. Near Breakouts as of 5:57 pm
| Symbol | Comp Rating | Industry Name | Current Price | Price % Chg | Volume (1000s) | Price $ Chg | EPS Rating | RS Rating | Ind Group RS | SMR Rating | A/D Rating | Market Cap (mil) |
| RBC Bearings Incorporated(RBC.US) | 96 | Metal Products - Distributors/Fabrication | 626.61 | 1.57 | 27 | 9.66 | 94 | 81 | A | A | D+ | 19,517.40 |
| Howmet Aerospace Inc.(HWM.US) | 96 | Aerospace/Defense | 277.28 | 2.53 | 410 | 6.84 | 98 | 79 | C+ | A | C+ | 108,205.10 |
| Watts Water Technologies, Inc. Class A(WTS.US) | 97 | Building - Construction Products | 339.23 | 1.79 | 79 | 5.95 | 93 | 71 | A- | A | B+ | 11,128.50 |
| Arcosa, Inc.(ACA.US) | 95 | Building - Construction Products | 131.68 | 2.52 | 58 | 3.23 | 91 | 79 | A- | B | B+ | 6,305.90 |
| SOLARIS ENERGY INFRASTRUCTUR(SEI.US) | 94 | Electrical-Power/Equipmt | 78.06 | -0.01 | 477 | -0.01 | 71 | 94 | A- | A | C | 5,741.40 |
| Keysight Technologies Inc(KEYS.US) | 96 | Elec-Scientific/Msrng | 353.92 | -0.85 | 130 | -3.02 | 80 | 92 | A+ | A | D+ | 60,999.40 |
| Cummins Inc.(CMI.US) | 84 | Trucks & Parts-Hvy Duty | 691.1 | 1.68 | 133 | 11.38 | 65 | 88 | A- | B | D- | 93,792.50 |
| Equinix, Inc.(EQIX.US) | 77 | REITs | 1,102.97 | 3.63 | 126 | 38.59 | 55 | 73 | B+ | B | D+ | 104,973.70 |
Subscribe to The Trend Catcher Topic / The Value Anchor Topic —unlock the full historical archive and never miss a weekly pick again.
Stocks In Focus:
| Company Fundamentals | Details |
|---|---|
| EPS Due Date | 8/11/2026 |
| EPS % Chg (Last Qtr) | 68% |
| 3 Year EPS Growth Rate | 0% |
| EPS Est % Chg (Current Yr) | -2% |
| Annual ROE | 7% |
| Sales % Chg (Last Qtr) | 21% |
| 3-Year Sales Growth Rate | 20% |
| Debt % | 4% |
| Market Cap | $4 Bil |
| Annual Pre-Tax Margin | 21.55% |
| Sector | Medical |
| Industry Group | Medical-Services |
| Industry Group Rank | 5 |
More of Our Investment Philosophy>>
Disclaimer: The content is provided as general information only and should not be taken as investment advice. All the contents shall not be taken as a recommendation to buy or sell any security or financial instruments. Any action you take resulting from information, analysis, or commentary on this article is your responsibility. Please consult your investment advisor before making any investments.