Top Dividend Stocks Including NBT Bancorp And Two More
NBT Bancorp Inc. NBTB | 45.16 | -1.38% |
The United States market has experienced a 1.2% increase over the last week and a notable 33% rise over the past year, with earnings projected to grow by 16% annually. In this thriving environment, identifying strong dividend stocks can be crucial for investors seeking both income and potential growth, as they offer regular payouts while potentially benefiting from overall market gains.
Top 10 Dividend Stocks In The United States
| Name | Dividend Yield | Dividend Rating |
| Provident Financial Services (PFS) | 4.44% | ★★★★★★ |
| Peoples Bancorp (PEBO) | 4.87% | ★★★★★★ |
| OTC Markets Group (OTCM) | 5.49% | ★★★★★★ |
| Omega Healthcare Investors (OHI) | 5.90% | ★★★★★★ |
| First Interstate BancSystem (FIBK) | 5.66% | ★★★★★★ |
| First Community Bankshares (FCBC) | 5.31% | ★★★★★★ |
| Farmers National Banc (FMNB) | 5.01% | ★★★★★★ |
| Ennis (EBF) | 4.60% | ★★★★★★ |
| Dillard's (DDS) | 5.43% | ★★★★★★ |
| Columbia Banking System (COLB) | 5.35% | ★★★★★★ |
Here we highlight a subset of our preferred stocks from the screener.
NBT Bancorp (NBTB)
Simply Wall St Dividend Rating: ★★★★★☆
Overview: NBT Bancorp Inc. is a financial holding company offering personal and commercial banking, retail banking, and wealth management services in the United States, with a market cap of $2.28 billion.
Operations: NBT Bancorp Inc. generates revenue through its primary segments of Banking, which accounts for $590.18 million, and Retirement Plan Administration, contributing $66.67 million.
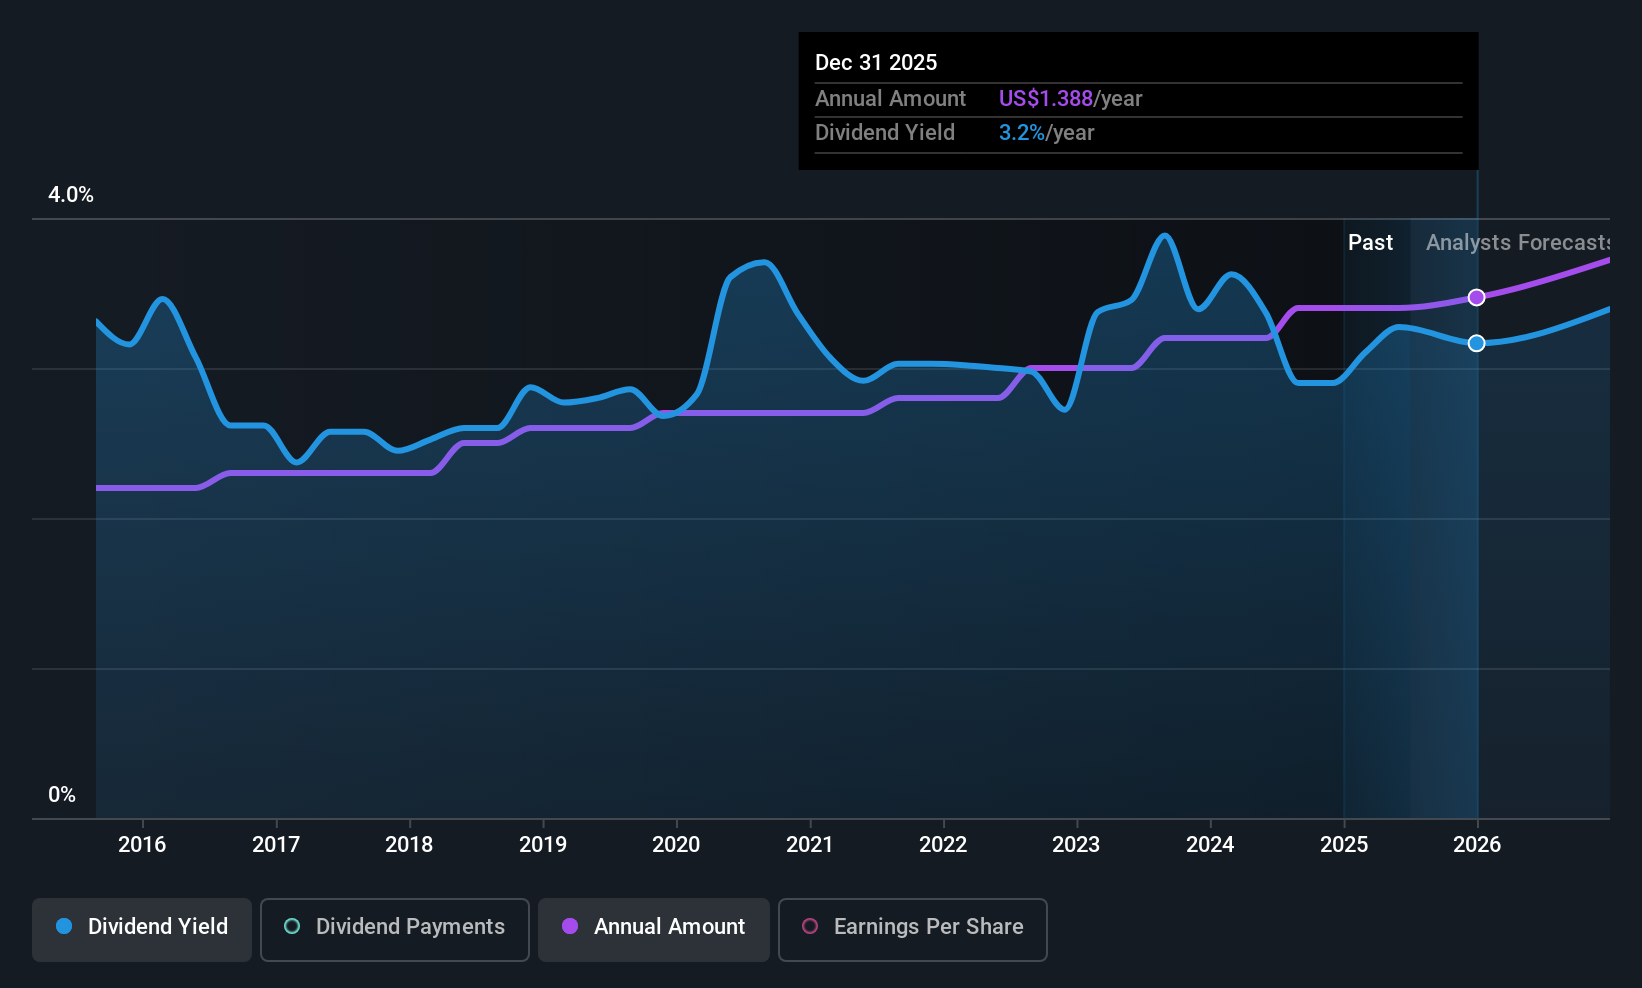
Dividend Yield: 3.4%
NBT Bancorp has demonstrated consistent dividend growth, marking its thirteenth consecutive annual increase with a recent 8.8% boost to US$0.37 per share. The company's dividends are well-covered by earnings, with a current payout ratio of 42.5% and forecasted to be even lower at 33.9% in three years, indicating sustainability. Despite trading below estimated fair value and stable dividends over the past decade, insider selling could be a concern for potential investors.
Bar Harbor Bankshares (BHB)
Simply Wall St Dividend Rating: ★★★★★☆
Overview: Bar Harbor Bankshares is the holding company for Bar Harbor Bank & Trust, offering a range of banking and nonbanking products and services to consumers and businesses, with a market cap of approximately $556.67 million.
Operations: Bar Harbor Bankshares generates revenue primarily from its Community Banking Industry segment, which amounts to $163.41 million.
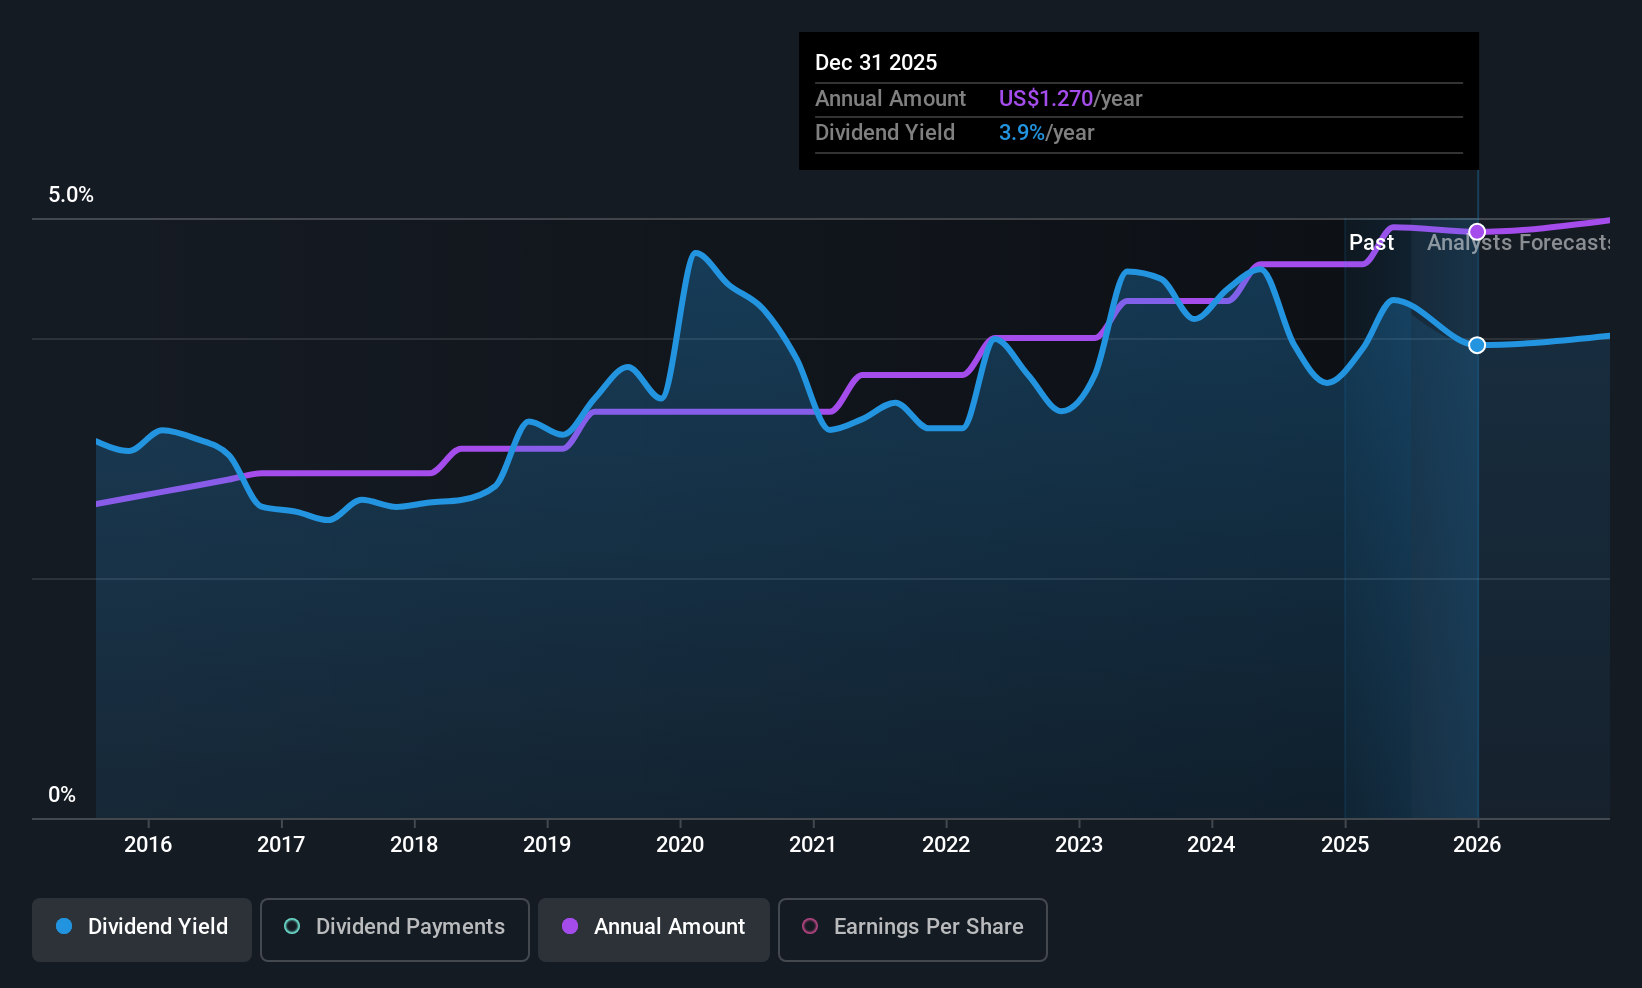
Dividend Yield: 3.8%
Bar Harbor Bankshares offers a stable dividend yield of 3.81%, supported by a payout ratio of 54.2%, indicating dividends are well-covered by earnings. Recent dividend affirmations reflect reliability, with payments steadily increasing over the past decade. Despite net income decline to US$36.92 million for 2025, net interest income rose to US$134.48 million, showing operational strength. Trading at a significant discount to estimated fair value suggests potential for capital appreciation alongside dependable dividends.
Omega Healthcare Investors (OHI)
Simply Wall St Dividend Rating: ★★★★★★
Overview: Omega Healthcare Investors, Inc. is a Real Estate Investment Trust (REIT) that provides financing and capital to the long-term healthcare industry, focusing on skilled nursing and assisted living facilities in the United States and the United Kingdom, with a market cap of $13.76 billion.
Operations: Omega Healthcare Investors generates revenue primarily through its investments in healthcare-related real estate properties, amounting to $1.19 billion.
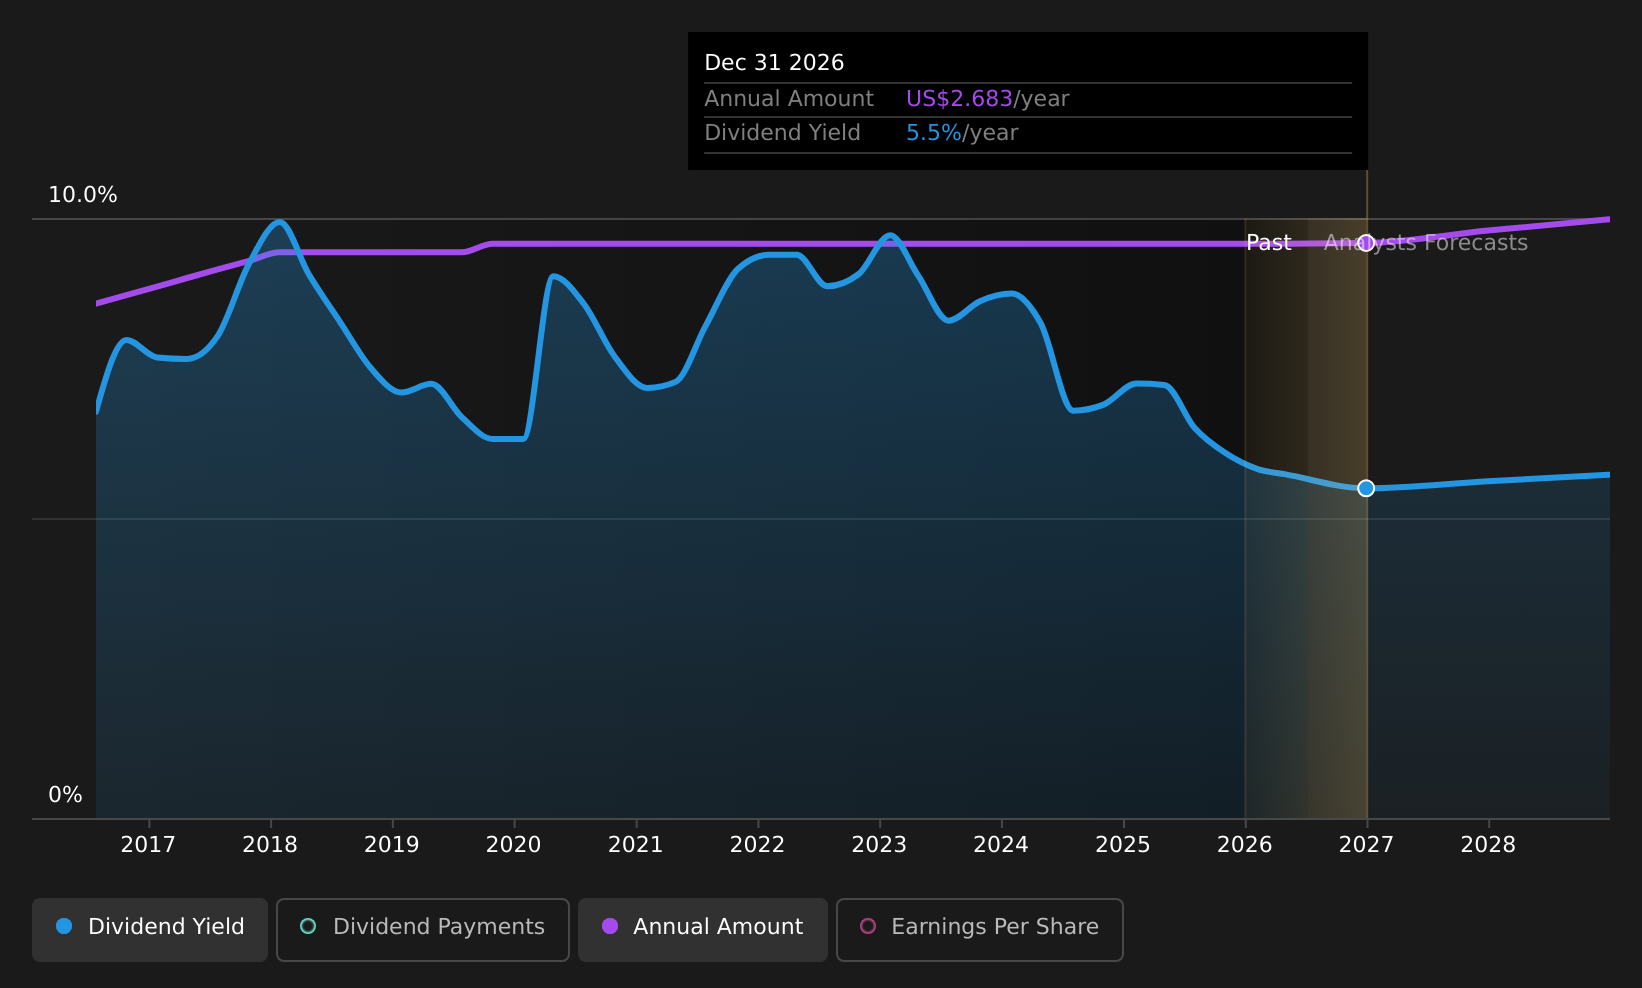
Dividend Yield: 5.9%
Omega Healthcare Investors maintains a robust dividend yield of 5.9%, ranking in the top 25% among U.S. dividend payers, with dividends growing and stable over the past decade. The payout ratio is 86.8%, indicating dividends are covered by earnings, while a cash payout ratio of 93.5% suggests coverage by cash flows as well. Despite high debt levels, recent earnings growth of 40.8% and trading below estimated fair value highlight its potential appeal for income-focused investors.
Where To Now?
- Delve into our full catalog of 109 Top US Dividend Stocks here.
- Are these companies part of your investment strategy? Use Simply Wall St to consolidate your holdings into a portfolio and gain insights with our comprehensive analysis tools.
- Invest smarter with the free Simply Wall St app providing detailed insights into every stock market around the globe.
Ready To Venture Into Other Investment Styles?
- Explore high-performing small cap companies that haven't yet garnered significant analyst attention.
- Fuel your portfolio with companies showing strong growth potential, backed by optimistic outlooks both from analysts and management.
- Find companies with promising cash flow potential yet trading below their fair value.
This article by Simply Wall St is general in nature. We provide commentary based on historical data and analyst forecasts only using an unbiased methodology and our articles are not intended to be financial advice. It does not constitute a recommendation to buy or sell any stock, and does not take account of your objectives, or your financial situation. We aim to bring you long-term focused analysis driven by fundamental data. Note that our analysis may not factor in the latest price-sensitive company announcements or qualitative material. Simply Wall St has no position in any stocks mentioned.