Tradeweb Markets (TW) Net Margin Strength Challenges Bearish Growth Narrative
Tradeweb Markets TW | 120.71 120.71 | -0.59% 0.00% Pre |
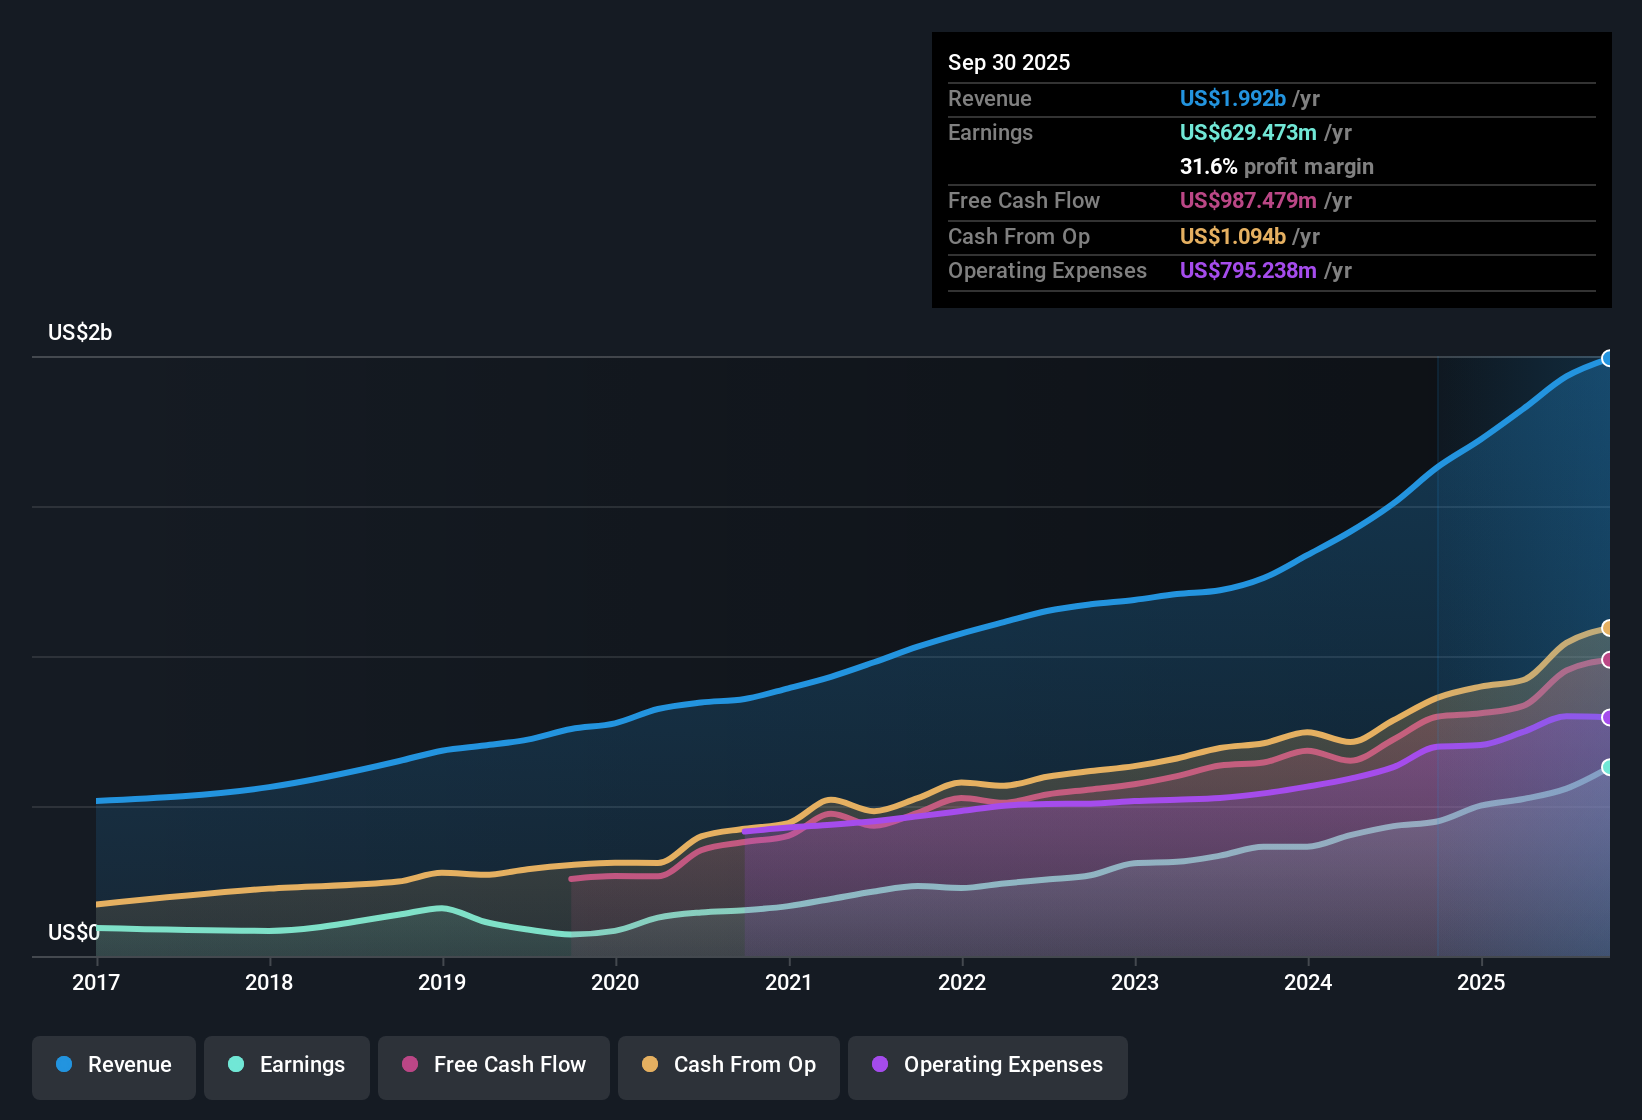
Tradeweb Markets (TW) has wrapped up FY 2025 with fourth quarter revenue of US$520.8 million and basic EPS of US$1.52, capping a year where trailing twelve month revenue reached about US$2.1 billion and EPS came in at US$3.83. Over the past year, revenue has moved from US$1.72 billion to about US$2.1 billion on a trailing basis while basic EPS has climbed from US$2.35 to US$3.83, so the latest print sits on top of a steadily higher earnings run rate. With net income and margins running firmly in positive territory, this earnings release puts profitability front and center for investors watching how efficiently the platform is converting volumes into bottom line results.
See our full analysis for Tradeweb Markets.With the headline numbers on the table, the next step is to see how this earnings profile lines up against the widely shared bull and bear narratives around Tradeweb and where those stories may need updating.
39.6% net margin stands out
- On a trailing basis, Tradeweb earned US$812.8 million of net income on US$2.1b of revenue, which works out to a 39.6% net profit margin compared with 29.1% a year earlier.
- What jumps out for a bullish view is that this higher margin sits alongside 62.2% earnings growth over the last 12 months and 26.8% per year over five years. This raises the question of how much of that strength can persist if forecasts point to roughly 10.48% annual earnings growth and about 9% revenue growth from here.
- Supporters of the bullish angle can point to the current 39.6% margin and US$3.83 trailing EPS as evidence that recent profitability is being sustained at a higher level than in the past year.
- At the same time, those same investors have to weigh that strong history against the lower forecast growth rates compared with the broader US market, which the dataset shows at 15.6% expected earnings growth and 10.2% revenue growth.
Revenue growth trails wider market
- Revenue on a trailing 12 month basis is US$2.1b and is forecast to grow about 9% per year, which is below the 10.2% revenue growth figure cited for the broader US market in the same dataset.
- Bears focus on this slower forecast, arguing that when a business is expected to grow revenue and earnings more slowly than the wider market, the 9% and roughly 10.48% figures in the data can make it harder to justify paying a premium valuation if those growth rates stay below market levels.
- The tension for that bearish angle is that recent earnings grew 62.2% year on year, which is well above those forward looking numbers, so the trailing record looks stronger than the forecasts.
- Critics still highlight that if growth normalizes toward the lower forecast rates, the gap versus the market growth numbers could matter for how investors think about future returns from here.
P/E premium and DCF gap
- The shares trade at a P/E of 29.4x, above the peer average of 25x and the US capital markets industry average of 22.9x, and the current share price of US$112.13 sits above the US$79.39 DCF fair value shown in the dataset.
- What is interesting for a bearish narrative is that this higher multiple and the gap between price and DCF fair value appear alongside forecast earnings growth of about 10.48% and revenue growth of about 9%. Some cautious investors see this as a mismatch between price and the growth profile being modeled.
- Skeptics point to the premium over peers on P/E and the US$32.74 difference between the share price and DCF fair value as signs that expectations are already demanding.
- On the other hand, the bears have to reconcile that view with the very strong trailing profitability metrics, including the 39.6% net margin and multi year 26.8% earnings compounding, which help explain why some investors have been comfortable assigning a richer multiple.
Next Steps
Don't just look at this quarter; the real story is in the long-term trend. We've done an in-depth analysis on Tradeweb Markets's growth and its valuation to see if today's price is a bargain. Add the company to your watchlist or portfolio now so you don't miss the next big move.
See What Else Is Out There
For all of Tradeweb's strong profitability, the mix of slower forecast growth than the wider market and a premium P/E with a DCF gap may concern you.
If that disconnect between growth expectations and valuation gives you pause, take a look at our 53 high quality undervalued stocks sourced from the screener and see which alternatives line up better with your comfort zone.
This article by Simply Wall St is general in nature. We provide commentary based on historical data and analyst forecasts only using an unbiased methodology and our articles are not intended to be financial advice. It does not constitute a recommendation to buy or sell any stock, and does not take account of your objectives, or your financial situation. We aim to bring you long-term focused analysis driven by fundamental data. Note that our analysis may not factor in the latest price-sensitive company announcements or qualitative material. Simply Wall St has no position in any stocks mentioned.