Trading Wisdom | What Is Fibonacci Retracement? How Do Traders Use It to Profit in the Stock Market?-Part I
Coca-Cola Company KO | 76.72 | +0.84% |
Walmart Inc. WMT | 125.79 | +0.84% |
Target Corporation TGT | 120.45 | 0.00% |
Lowe's Companies, Inc. LOW | 231.03 | -2.10% |
1. What are the Fibonacci sequence and the Golden ratio?
A Fibonacci sequence is a number pattern that was discovered and introduced in the 13th century by the Italian mathematician Leonardo of Pisa, who was also known as Fibonacci. This is debated, however, by historians who believe the sequence was actually discovered by Indian mathematicians hundreds of years prior.
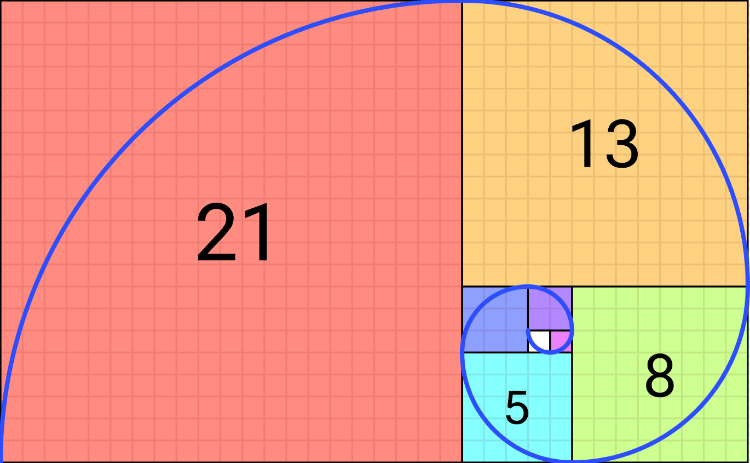
In this number sequence, each number is the sum of the two numbers immediately preceding it. As the sequence continues, they form a pattern where each number is approximately 1.618 times greater than the preceding one.
The number 1.618 is called the Golden Ratio or Phi. Interestingly, many natural objects and artificial architectures, such as rose petals, human faces, the Great Pyramid of Giza, and many famous paintings, all follow the golden ratio pattern.
Because the Fibonacci sequence and the golden ratio abound in nature, traders believe that they can also be used in the financial markets to predict price movements. Traders use the Fibonacci sequence and Golden Ratio for determining pullbacks and impulses on price charts.
2. What is Fibonacci Retracement?
The Fibonacci retracement originates from the Fibonacci sequence, which highlights support and resistance levels by drawing horizontal lines on a price chart. The retracement levels are set at multiples of 1.618 or the golden ratio. For example, the first retracement level is at 23.6%, followed by the second level at 38.2%, the third at 61.8%, and the fourth at 78.6%. So, when there is a strong up or downtrend, the price usually retraces at any of these levels.
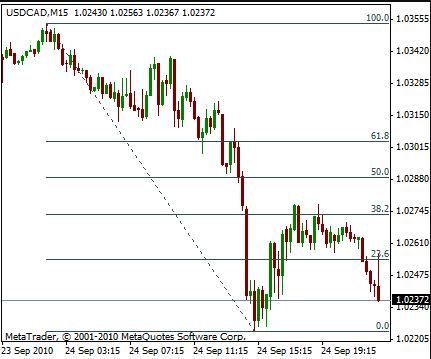
The Fibonacci retracements are widely used to determine price levels for impulses and pullbacks in an uptrend or a downtrend. For example, in an uptrend, the price often makes small pullbacks and then again continues trending upwards.
Fibonacci retracement can help traders determine the level of support where the price pulls back before continuing in the direction of the trend. The retracement level can be used as a potential entry point in a trending market. While Fibonacci retracements can be useful, you should use them in conjunction with other indicators to corroborate your findings.
3. Is trading with Fibonacci profitable?
Price charts represent traders' psychology, and Fibonacci numbers can help you interpret the price charts and important price levels. However, like any other technical indicator and tool, Fibonacci, too, has its limitations. So, it is important to know when it works the best and how you can use it to execute your trading strategies profitably.
Traders can use Fibonacci sequences and Fibonacci retracements profitably in trending and fast-moving markets as the strategy works well most of the time in such conditions. In contrast, it doesn't work as well during market corrections and range-bound conditions.
The Fibonacci tool can help you find entry and exit points on the price chart and also facilitate placing your stop loss and take profit points. This allows you to trade purely on the basis of price action, taking emotions away from your trading.
4. How to calculate Fibonacci retracement lines?
Fibonacci retracement lines can be calculated by finding out the position of different Fibonacci percentages from a given price point. Let us illustrate this with an example:
Suppose the price of a stock increases from $20 to $30, you can calculate the 23.6% Fibonacci level in the following way:
$30 - ($10 x 23.6%) = $27.64
According to the calculation above, the 23.6% Fibonacci line should be at $27.64 if the price increases by $10 from $20 to $30.
Similarly, you can also calculate the 50% Fibonacci level, though it isn't "technically" considered part of the sequence.
$30 - ($10 x 50%) = $25
The equation shows that the 50% Fibonacci level for the price increase from $20 to $30 is $25. This means that the price should retrace at $25 while trending upwards from $20 to $30.
The Fibonacci levels are based simply on percentages and are derived by dividing a number by the next one in the sequence.
If you see that a stock's price is trending higher and has retraced to a Fibonacci level, it might be an indication that the stock might continue its overall trend unless another indicator tells you otherwise. For example, you can use an MACD indicator or a stochastic indicator to further solidify your analysis before executing your trade.