TransUnion (TRU) Margin Jump To 9.5% Challenges Earnings Skeptics
TransUnion TRU | 69.32 | +0.77% |
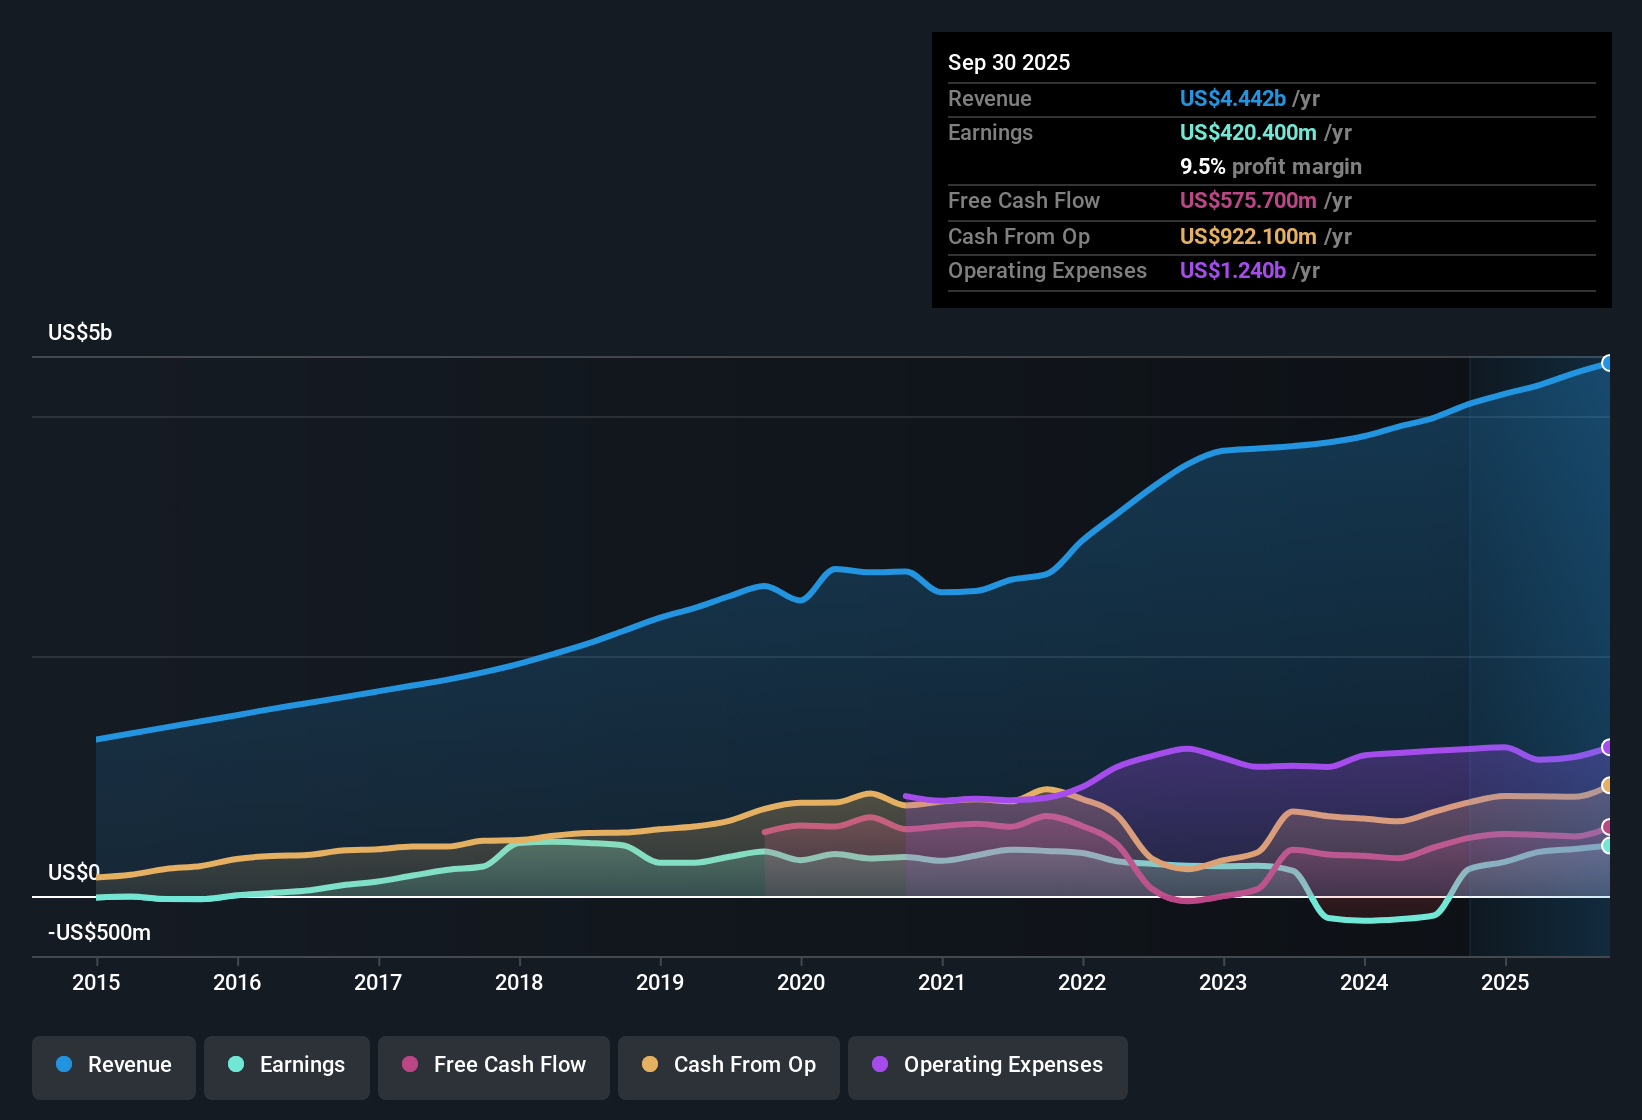
TransUnion (TRU) just posted its latest FY 2025 numbers with Q3 revenue of US$1.2b, basic EPS of US$0.50 and net income excluding extra items of US$96.6m, set against trailing 12 month revenue of US$4.4b and EPS of US$2.16. These figures reflect an 87.5% year over year earnings jump and a move in net margin from 5.5% to 9.5%. The company has seen quarterly revenue range from US$1.0b in Q4 2024 to US$1.2b in Q3 2025. Over the same period, quarterly EPS moved from US$0.34 to US$0.76 and then US$0.50, giving investors plenty to think about as they weigh improving profitability against how durable these margins look.
See our full analysis for TransUnion.With the headline figures on the table, the next step is to see how they line up with the most common narratives around TransUnion, where some long held views about its growth and risk profile may be reinforced while others face a reality check.
9.5% net margin puts profitability in clearer focus
- On a trailing basis, TransUnion generated US$4.4b of revenue and US$420.4m of net income excluding extra items, which works out to a 9.5% net margin versus 5.5% a year earlier.
- Analysts' consensus view leans on technology and analytics as long term margin drivers, and the current numbers give you a mixed scorecard:
- The 87.5% year over year earnings increase and move to a 9.5% net margin line up with the idea that higher margin analytics and fraud products are gaining traction, even though quarterly EPS has stepped down from US$0.76 in Q1 2025 to US$0.50 in Q3 2025.
- At the same time, the longer term record of earnings declining an average 11.1% per year over five years reminds you that execution on areas like cloud platforms and AI tools has not yet translated into a steady margin profile.
Revenue growth sits around mid single digits
- Trailing 12 month revenue sits at US$4.4b, up from US$4.0b a year earlier, while forecasts point to about 7.5% annual revenue growth and roughly 18.3% annual earnings growth going forward.
- Consensus narrative argues that growing demand for predictive data and compliance solutions supports sustained revenue growth, and the current run rate partly backs that up, with caveats:
- The move in quarterly revenue from US$1.0b in Q4 2024 to US$1.2b in Q3 2025 and the lift in trailing revenue from US$4.0b to US$4.4b are consistent with that demand story, especially as TransUnion expands in markets like India, Africa, and Latin America.
- However, the gap between forecast earnings growth of 18.3% and forecast revenue growth of 7.5% suggests a lot of the bullish case depends on margin expansion rather than top line acceleration alone, which puts more pressure on execution in those higher margin product areas.
Valuation signals are pulling in different directions
- At a share price of US$70.81, the stock trades on a trailing P/E of 32.7x compared with peers at 28.2x and the Professional Services industry at 19.7x, while a DCF fair value of about US$215.07 and an analyst price target of US$105.25 both sit well above the current price.
- Critics highlight that debt is not well covered by operating cash flow, and that concern sits alongside the premium P/E, creating tension with the more optimistic narrative built around growth and valuation:
- The large gap between the US$70.81 share price and the DCF fair value of roughly US$215.07 plus an analyst target of US$105.25 suggests one set of models sees meaningful upside, even though the market is currently assigning a lower value.
- Set against that, the 32.7x P/E multiple versus 28.2x for peers and 19.7x for the industry, together with flagged debt coverage risk, gives bears a concrete reason to question how much of that growth and margin improvement is already reflected in the valuation.
Next Steps
To see how these results tie into long-term growth, risks, and valuation, check out the full range of community narratives for TransUnion on Simply Wall St. Add the company to your watchlist or portfolio so you'll be alerted when the story evolves.
See the numbers in a different light? Put that view to work, shape your own take in just a few minutes, and Do it your way
A great starting point for your TransUnion research is our analysis highlighting 4 key rewards and 1 important warning sign that could impact your investment decision.
See What Else Is Out There
TransUnion's premium 32.7x P/E, debt coverage concerns, and reliance on margin expansion rather than broad based revenue growth may leave you questioning its risk profile.
If that mix of higher valuation and balance sheet pressure feels uncomfortable, take a few minutes to size up companies screened for resilience through 84 resilient stocks with low risk scores and see how they compare.
This article by Simply Wall St is general in nature. We provide commentary based on historical data and analyst forecasts only using an unbiased methodology and our articles are not intended to be financial advice. It does not constitute a recommendation to buy or sell any stock, and does not take account of your objectives, or your financial situation. We aim to bring you long-term focused analysis driven by fundamental data. Note that our analysis may not factor in the latest price-sensitive company announcements or qualitative material. Simply Wall St has no position in any stocks mentioned.