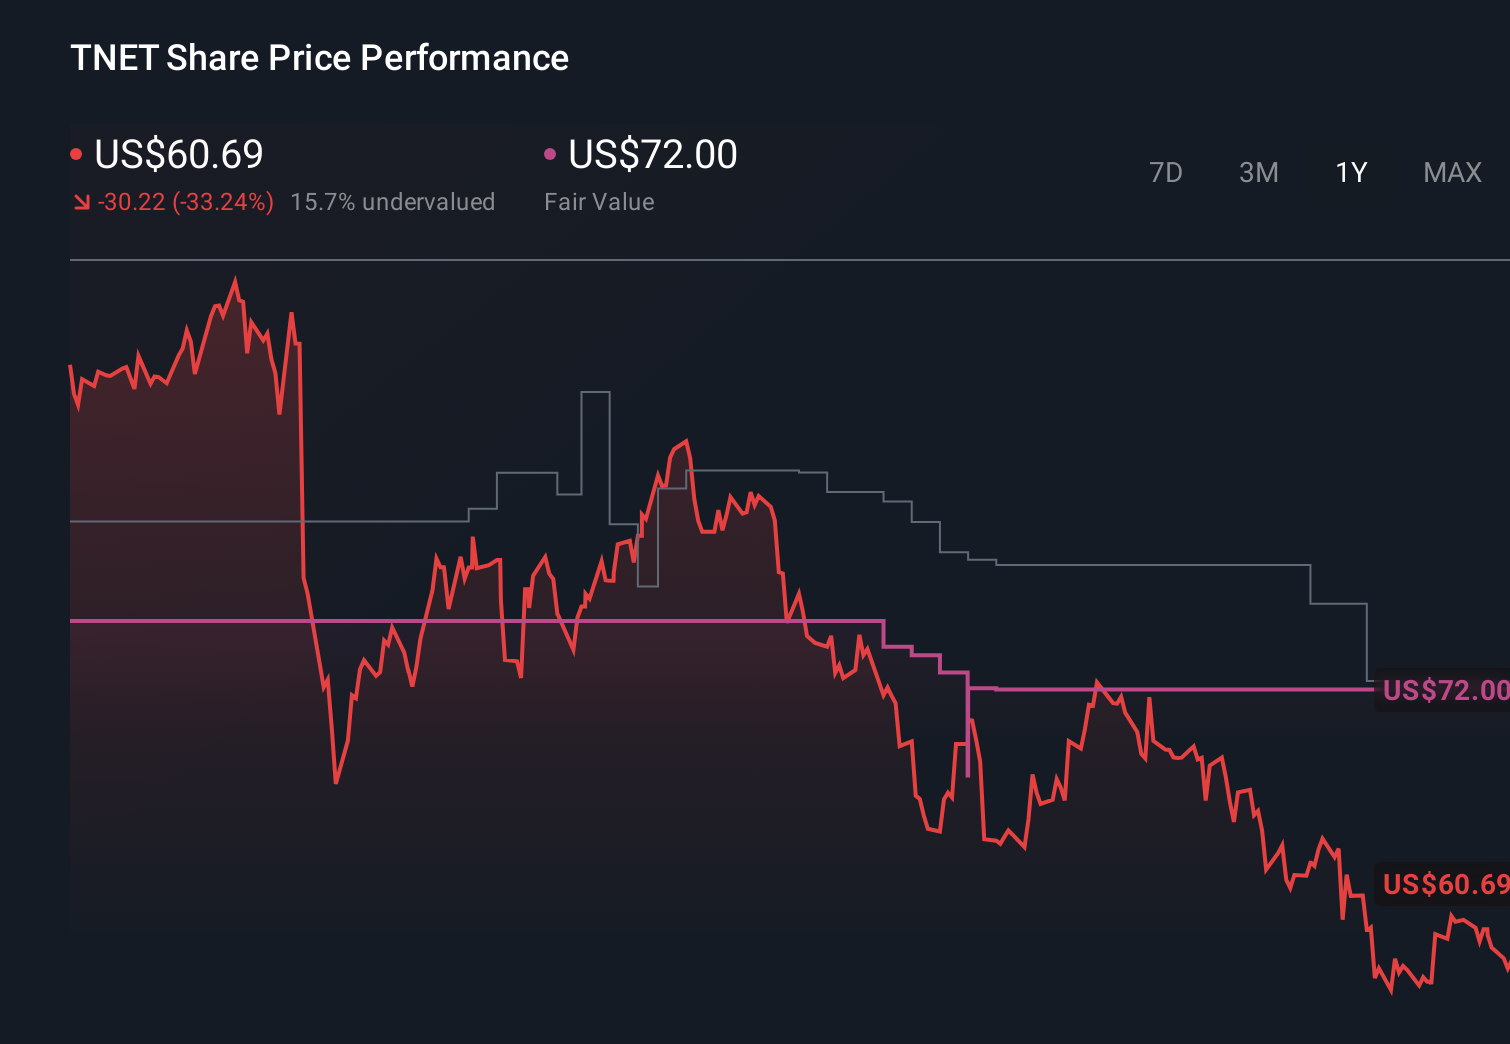
TriNet Group (TNET) Enters Russell 2000 Dynamic Index as Dividend Raises New Capital Return Questions
TriNet Group, Inc. TNET | 0.00 |
- TriNet Group, Inc. was recently added to the Russell 2000 Dynamic Index and, in June, its board affirmed a US$0.29 per-share dividend payable on July 27, 2026.
- The index inclusion can attract incremental demand from benchmark-tracking investors, while the steady dividend signals ongoing board confidence in returning cash to shareholders.
- Next, we’ll examine how TriNet’s addition to the Russell 2000 Dynamic Index reshapes its investment narrative around growth and capital returns.
The future of work is here. Discover the 29 top robotics and automation stocks leading the charge in AI-driven automation and industrial transformation.
TriNet Group Investment Narrative Recap
To own TriNet, you need to believe that outsourcing complex HR, benefits and compliance will remain essential for small and mid-sized businesses, even as technology reshapes how those services are delivered. The most important near term catalyst is whether TriNet can stabilize worksite employee volumes and defend margins as healthcare costs rise. Index inclusion and the affirmed dividend support the shareholder story but do not materially change these underlying volume and cost risks in the short term.
The recent confirmation of a US$0.29 per share dividend feels most relevant here, because it highlights TriNet’s ongoing commitment to capital returns at the same time its core business is wrestling with healthcare cost inflation and competitive pressure. For investors focused on near term catalysts, that cash return sits alongside continued product investments such as AI assisted HR tools, which aim to keep TriNet’s offering compelling as clients consider alternatives.
Yet behind the reassuring dividend, investors should be aware of rising healthcare cost pressures and the risk that...
TriNet Group's narrative projects $1.2 billion revenue and $207.2 million earnings by 2029. This implies a 38.1% yearly revenue decline and an earnings increase of about $52 million from $155.0 million today.
Uncover how TriNet Group's forecasts yield a $54.00 fair value, a 9% upside to its current price.
Exploring Other Perspectives
While index inclusion and dividends may seem reassuring, the most pessimistic analysts still saw only about US$5.1 billion in 2029 revenue and US$210 million in earnings, reminding you that opinions on TriNet’s resilience to automation risks can differ widely and may shift again as this new index status and capital return profile are digested.
Explore 2 other fair value estimates on TriNet Group - why the stock might be worth as much as 9% more than the current price!
Reach Your Own Conclusion
Disagree with existing narratives? Extraordinary investment returns rarely come from following the herd, so go with your instincts.
- A great starting point for your TriNet Group research is our analysis highlighting 3 key rewards and 1 important warning sign that could impact your investment decision.
- Our free TriNet Group research report provides a comprehensive fundamental analysis summarized in a single visual - the Snowflake - making it easy to evaluate TriNet Group's overall financial health at a glance.
Ready To Venture Into Other Investment Styles?
The market won't wait. These fast-moving stocks are hot now. Grab the list before they run:
- AI is about to change healthcare. These 40 stocks are working on everything from early diagnostics to drug discovery. The best part - they are all under $10b in market cap - there's still time to get in early.
- Rare earth metals are an input to most high-tech devices, military and defence systems and electric vehicles. The global race is on to secure supply of these critical minerals. Beat the pack to uncover the 30 best rare earth metal stocks of the very few that mine this essential strategic resource.
- Capitalize on the AI infrastructure supercycle with our selection of the 51 best 'picks and shovels' of the AI gold rush converting record-breaking demand into massive cash flow.
This article by Simply Wall St is general in nature. We provide commentary based on historical data and analyst forecasts only using an unbiased methodology and our articles are not intended to be financial advice. It does not constitute a recommendation to buy or sell any stock, and does not take account of your objectives, or your financial situation. We aim to bring you long-term focused analysis driven by fundamental data. Note that our analysis may not factor in the latest price-sensitive company announcements or qualitative material. Simply Wall St has no position in any stocks mentioned.