

Tronox (TROX) Stock Still Looks Reasonable After A 65% Gain
Tronox Holdings Plc TROX | 0.00 |
Tronox Holdings has delivered a 65.3% gain over the past year, yet the stock still screens as undervalued on several checks, which raises questions about how much of that strength is already reflected in the current US$6.00 share price.
- The 65.3% return over the past year points to strong recent momentum that investors need to weigh against the longer history of weaker multi year returns.
- Expectations around Tronox Holdings' ability to convert revenue into consistent cash flows can support the current valuation, while any pressure on margins or balance sheet flexibility may limit how much investors are willing to pay for the stock.
- The company looks undervalued on 5 out of 6 checks, so the broader assessment on Simply Wall St's valuation page leans toward the shares trading below their assessed worth.
The issue now is whether Tronox Holdings' recent share price recovery still leaves enough potential upside for new investors at today's valuation.
Is Tronox Holdings a Bargain on Sales?
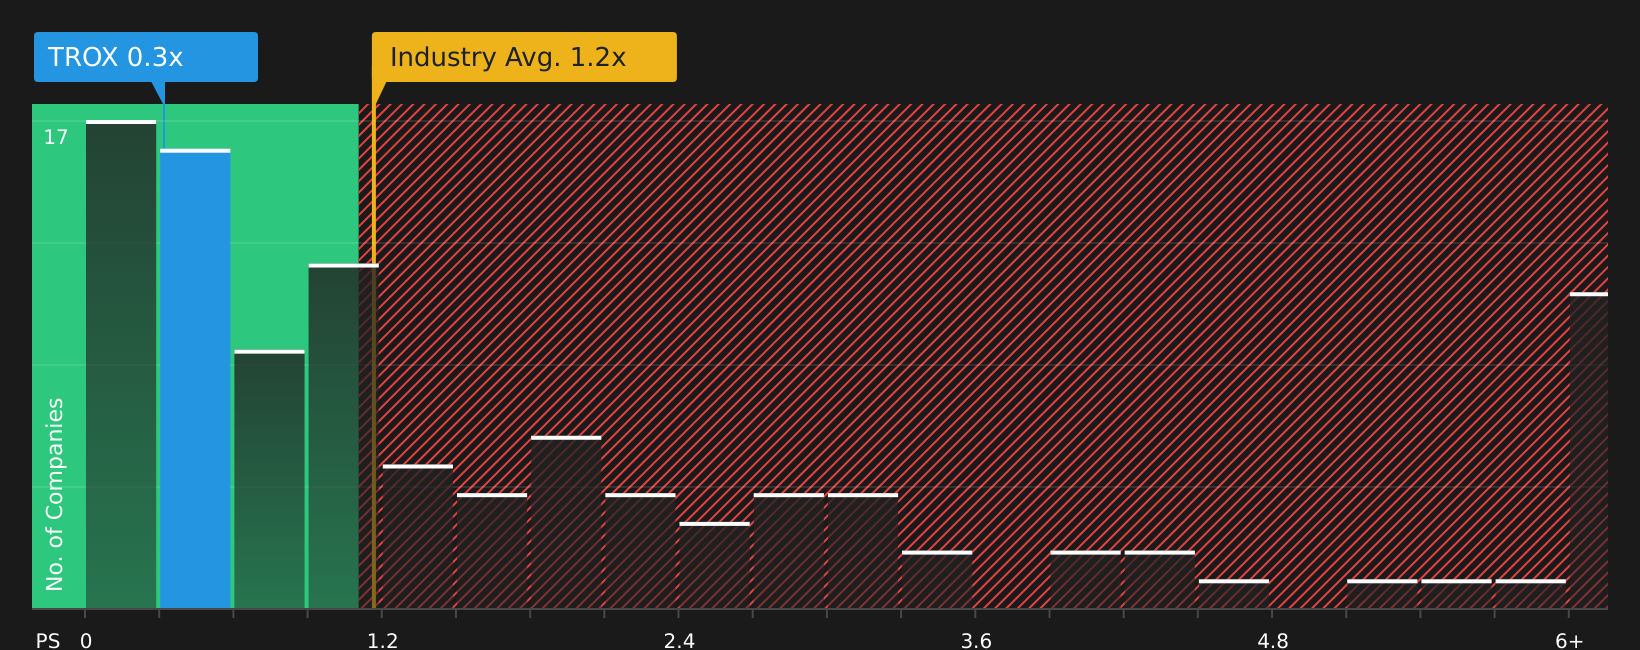
The P/S ratio suits Tronox Holdings because revenue is a cleaner reference point when earnings and free cash flow have been under pressure. The stock trades on a P/S of 0.3x, which is well below the Chemicals industry average of 1.2x and also below the peer group average of 0.7x.
The model based fair P/S ratio for Tronox Holdings is 0.7x, which already reflects assumptions about its risk profile and sector characteristics. Against that yardstick, the current 0.3x multiple sits at a sizeable discount and implies the market is pricing each dollar of Tronox Holdings revenue below what the model suggests.
On this P/S measure, Tronox Holdings stock appears undervalued relative to both its sector and the fair multiple implied by the broader checks.
The Tronox Holdings Narrative: What Would Justify Today's Price?
Simply Wall St Narratives help you connect Tronox Holdings' low P/S multiple with the underlying expectations that could make the stock worth materially more or less than today’s price, by spelling out which paths for growth, margins and earnings would need to play out. Each narrative links its implied number to a clear view on how Tronox Holdings' growth, profitability and risk might evolve, so you can revisit those assumptions as new information comes through.
Community views on Tronox Holdings sit far apart, with one side seeing upside from TiO2 exposure and cost work, and the other focused on debt and demand risk.
Bull case: 15% undervalued
"Tronox is well positioned to benefit from medium and long-term increases in demand for titanium dioxide in fast-growing markets such as India, where per-capita consumption is low and recent trade policies strongly favor Tronox's cost-advantaged supply, likely driving future revenue growth as urbanization and middle-class expansion accelerate in the region…"
Bear case: 50% overvalued
"Heightened competition from lower-cost producers, especially in China, along with persistent industry overcapacity and recent price erosion in major regions such as Europe, are expected to undermine both pricing power and volume growth, compressing Tronox's revenues and EBITDA for multiple years…"
Do you think there's more to the story for Tronox Holdings? Head over to our Community to see what others are saying!
The Bottom Line
Tronox Holdings still screens as undervalued on market multiples, particularly on its P/S ratio, which points to a discount against both sector peers and the modelled fair range. That potential upside only matters if Tronox Holdings can translate its revenue base into steadier cash flows and keep balance sheet risk contained. The key question is whether the current discount reflects excessive caution or a fair price for concerns around debt, margins and demand. For now, the crux of the bull and bear debate is whether profitability and cash generation improve enough for the market to re rate the stock closer to peer levels.
This article by Simply Wall St is general in nature. We provide commentary based on historical data and analyst forecasts only using an unbiased methodology and our articles are not intended to be financial advice. It does not constitute a recommendation to buy or sell any stock, and does not take account of your objectives, or your financial situation. We aim to bring you long-term focused analysis driven by fundamental data. Note that our analysis may not factor in the latest price-sensitive company announcements or qualitative material. Simply Wall St has no position in any stocks mentioned.