UGI (NYSE:UGI) Valuation After Central European LPG Sale And Debt Reduction Plan
UGI Corporation UGI | 36.77 | +1.94% |
UGI (UGI) has completed the sale of its LPG distribution businesses in the Czech Republic, Hungary, Poland, and Slovakia to DCC plc. Management plans to use the proceeds to reduce debt.
UGI shares have been relatively firm around US$38.06, with a 14.26% 90 day share price return and a 31.37% 1 year total shareholder return suggesting improving momentum as the European LPG sale and ongoing gas infrastructure projects reset expectations around risk and future focus.
If this kind of portfolio reshaping has your attention, it could be a good moment to widen your search and check out fast growing stocks with high insider ownership.
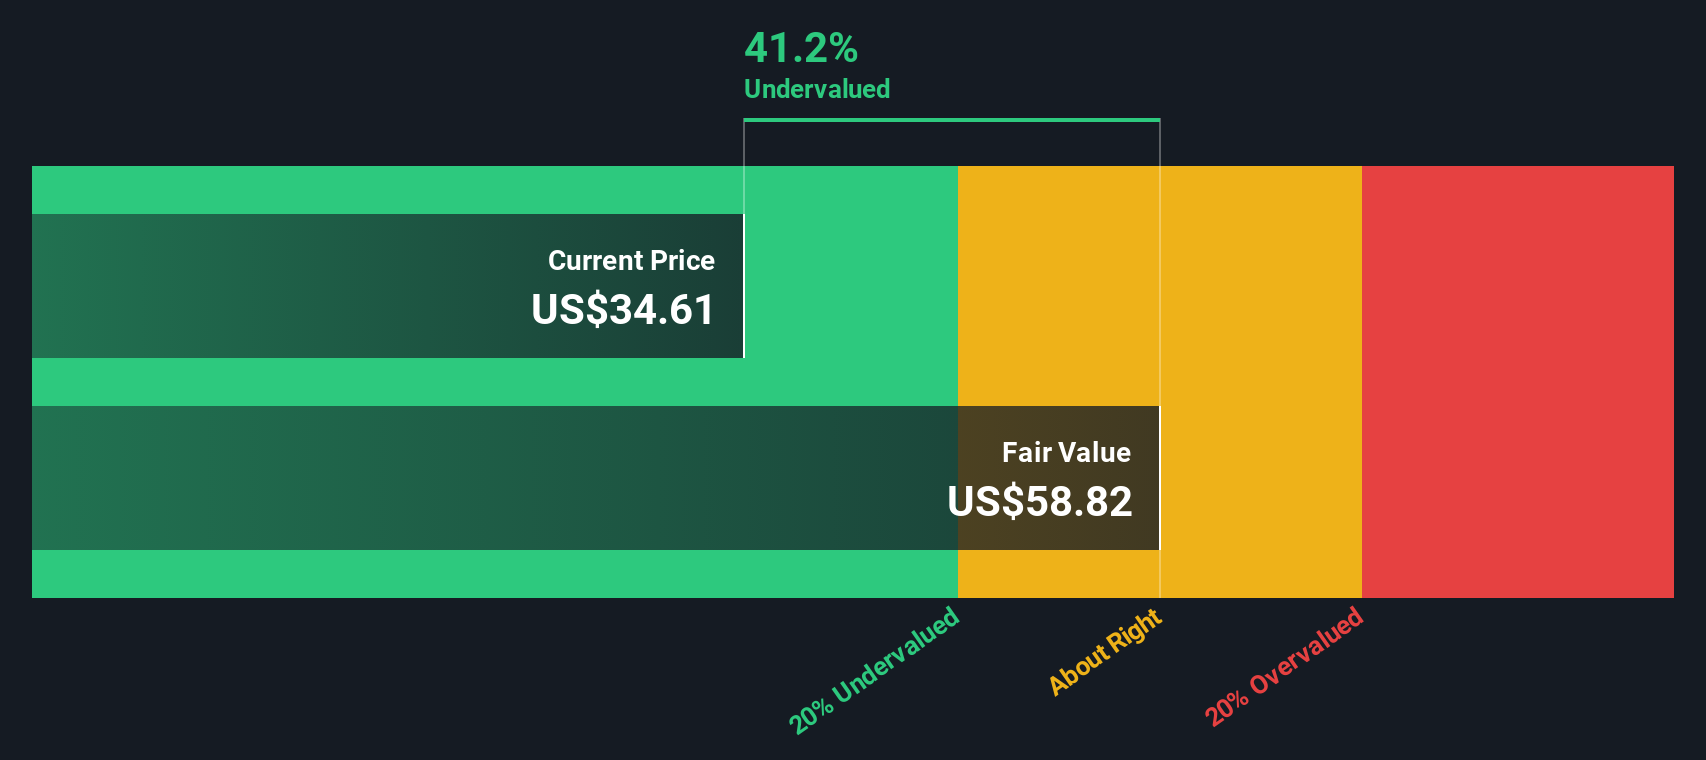
With UGI trading at US$38.06, reportedly at a 30% discount to one estimate of intrinsic value and below a US$44 price target, investors may ask whether this reflects a genuine value gap or whether the market is already pricing in future growth.
Price-to-Earnings of 12.1x: Is it justified?
At around US$38.06, UGI is on a P/E of 12.1x, which screens as inexpensive compared with both its peer group and the wider gas utilities industry.
The P/E ratio compares the current share price to earnings per share. For a business like UGI that already generates meaningful earnings, it helps you see how much investors are paying for those profits.
Here, the market is assigning UGI a P/E of 12.1x, while its global gas utilities peers sit at 14.3x and its direct peer average is 18.4x. Against an estimated fair P/E of 18x from the SWS fair ratio work, that gap is even clearer and suggests the multiple could move closer to that level if sentiment and fundamentals stay aligned.
Result: Price-to-Earnings of 12.1x (UNDERVALUED)
However, the story can change quickly if LPG market conditions soften or if UGI struggles to keep revenue and net income growth on track at recent annual rates.
Another View: What Does The DCF Say?
While the 12.1x P/E makes UGI look inexpensive, our DCF model points to a different yardstick. On that basis, UGI at US$38.06 sits around 29.7% below an estimated future cash flow value of US$54.15, which also implies an undervalued setup, but based on cash generation rather than earnings multiples.
This kind of gap can suggest opportunity if the cash flows materialise as expected, or a value trap if they do not. The real question is which story you think the cash flow line will tell over time.
Simply Wall St performs a discounted cash flow (DCF) on every stock in the world every day (check out UGI for example). We show the entire calculation in full. You can track the result in your watchlist or portfolio and be alerted when this changes, or use our stock screener to discover 880 undervalued stocks based on their cash flows. If you save a screener we even alert you when new companies match - so you never miss a potential opportunity.
Build Your Own UGI Narrative
If you see the numbers differently or want to stress test your own assumptions, spin up a custom view and build your version of the UGI story with Do it your way.
A great starting point for your UGI research is our analysis highlighting 5 key rewards and 1 important warning sign that could impact your investment decision.
Looking for more investment ideas?
If UGI has sharpened your thinking, do not stop here. The Screener can quickly surface other focused ideas across different themes so you are not leaving opportunities on the table.
- Target potential mispricings by scanning these 880 undervalued stocks based on cash flows, where the focus is on companies trading below their estimated cash flow value.
- Explore developments in technology by checking out these 23 AI penny stocks. This screener focuses on companies linked to artificial intelligence trends.
- Add diversified income ideas by reviewing these 13 dividend stocks with yields > 3%, a pre filtered set of companies offering dividend yields above 3%.
This article by Simply Wall St is general in nature. We provide commentary based on historical data and analyst forecasts only using an unbiased methodology and our articles are not intended to be financial advice. It does not constitute a recommendation to buy or sell any stock, and does not take account of your objectives, or your financial situation. We aim to bring you long-term focused analysis driven by fundamental data. Note that our analysis may not factor in the latest price-sensitive company announcements or qualitative material. Simply Wall St has no position in any stocks mentioned.