

US Market Pulse | Indexes Near Highs, AI Names Fracture, Goldman Eyes Optical — Defensive Beneath (Week Ending August 14)
Advanced Micro Devices, Inc. AMD | 0.00 | |
Broadcom Limited AVGO | 0.00 | |
NVIDIA Corporation NVDA | 0.00 | |
Apple Inc. AAPL | 0.00 | |
Meta Platforms META | 0.00 |
📅 Week ending August 14, 2026
This is a weekly framework as of the US market close. Objective description only — not investment advice. Markets carry risk; please do your own diligence.
1. Market Snapshot
The indices finished the August 14, 2026 session slightly lower but avoided a broader de-risking move. The Nasdaq closed at 26,729.16, down −0.28% on the day and up +4.74% over 20 sessions. The S&P 500 ended at 7,785.76, down −0.17%, while the Dow slipped −0.20% to 53,732.41.
Under the hood, this was not a flat tape. Advanced Micro Devices, Inc.(AMD.US) ripped +6.50% to 514.39, while Broadcom Limited(AVGO.US) fell −5.94% to 392.99. That spread captures what the market is trading: the AI complex remains funded, but the blanket bid has fractured. NVIDIA Corporation(NVDA.US) held almost unchanged at 225.16, whereas Apple Inc.(AAPL.US) , Meta Platforms(META.US) and Tesla Motors, Inc.(TSLA.US) remain down −8.33%, −8.69% and −10.13%, respectively, over 20 sessions.
| Name | Close | Day % | 5d % | 20d % |
|---|---|---|---|---|
| NASDAQ(IXIC.US) | 26,729.16 | −0.28% | +0.14% | +4.74% |
| S&P 500 index(SPX.US) | 7,785.76 | −0.17% | +0.36% | +4.40% |
| Dow Jones Industrial Average(DJI.US) | 53,732.41 | −0.20% | −0.56% | +3.04% |
| NVIDIA Corporation(NVDA.US) | 225.16 | −0.06% | +0.54% | +11.02% |
| Advanced Micro Devices, Inc.(AMD.US) | 514.39 | +6.50% | +6.42% | +3.76% |
| Broadcom Limited(AVGO.US) | 392.99 | −5.94% | −8.13% | +5.98% |
| Microsoft Corporation(MSFT.US) | 495.40 | −0.30% | −0.92% | +25.79% |
| Tesla Motors, Inc.(TSLA.US) | 342.27 | +0.68% | +4.17% | −10.13% |
🔔 Subscribe to The Trend Catcher Topic / The Value Anchor Topic
The Trend Catcher / The Value Anchor — unlock the full historical archive and never miss a weekly pick again.
2. DPWD Temperature Gauge & Index Position
DPWD is our original gauge built on three objective technical factors: moving average, MACD and RSI. Its readings reflect market temperature. Zones: ≥95 Aggressive / 85–95 Active / 75–85 Neutral / 65–75 Defensive / <55 Extremely Defensive. Chart window: last 120 trading days (calculations use full history).
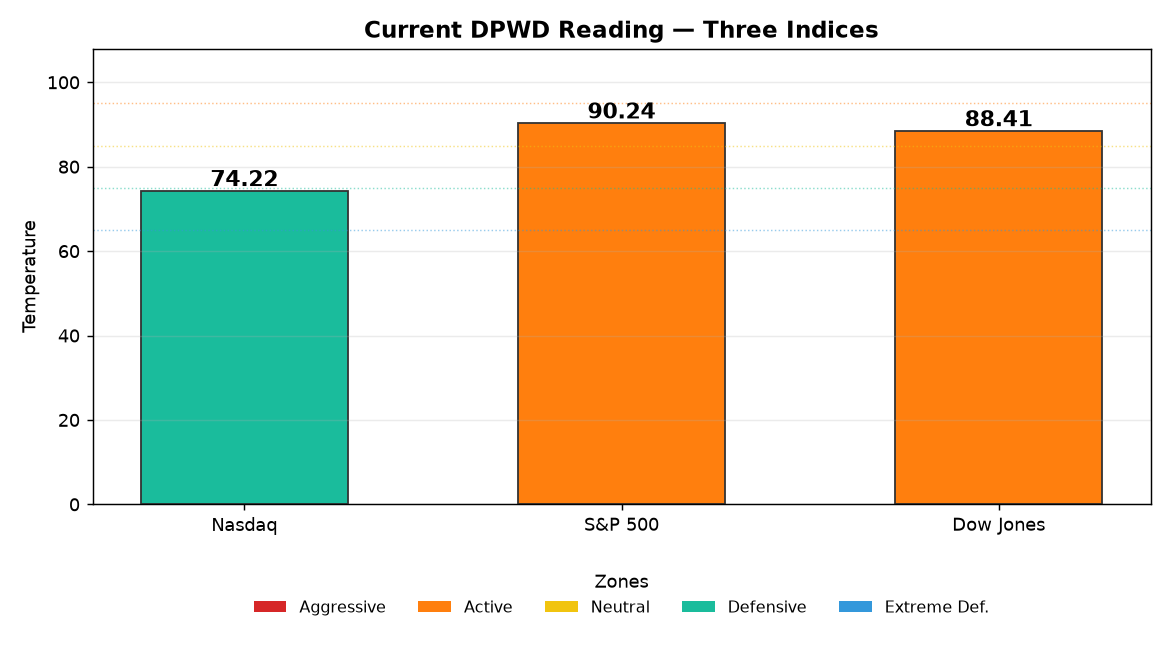
Figure 1 — DPWD temperature reading across the three major indices (TEMP10).
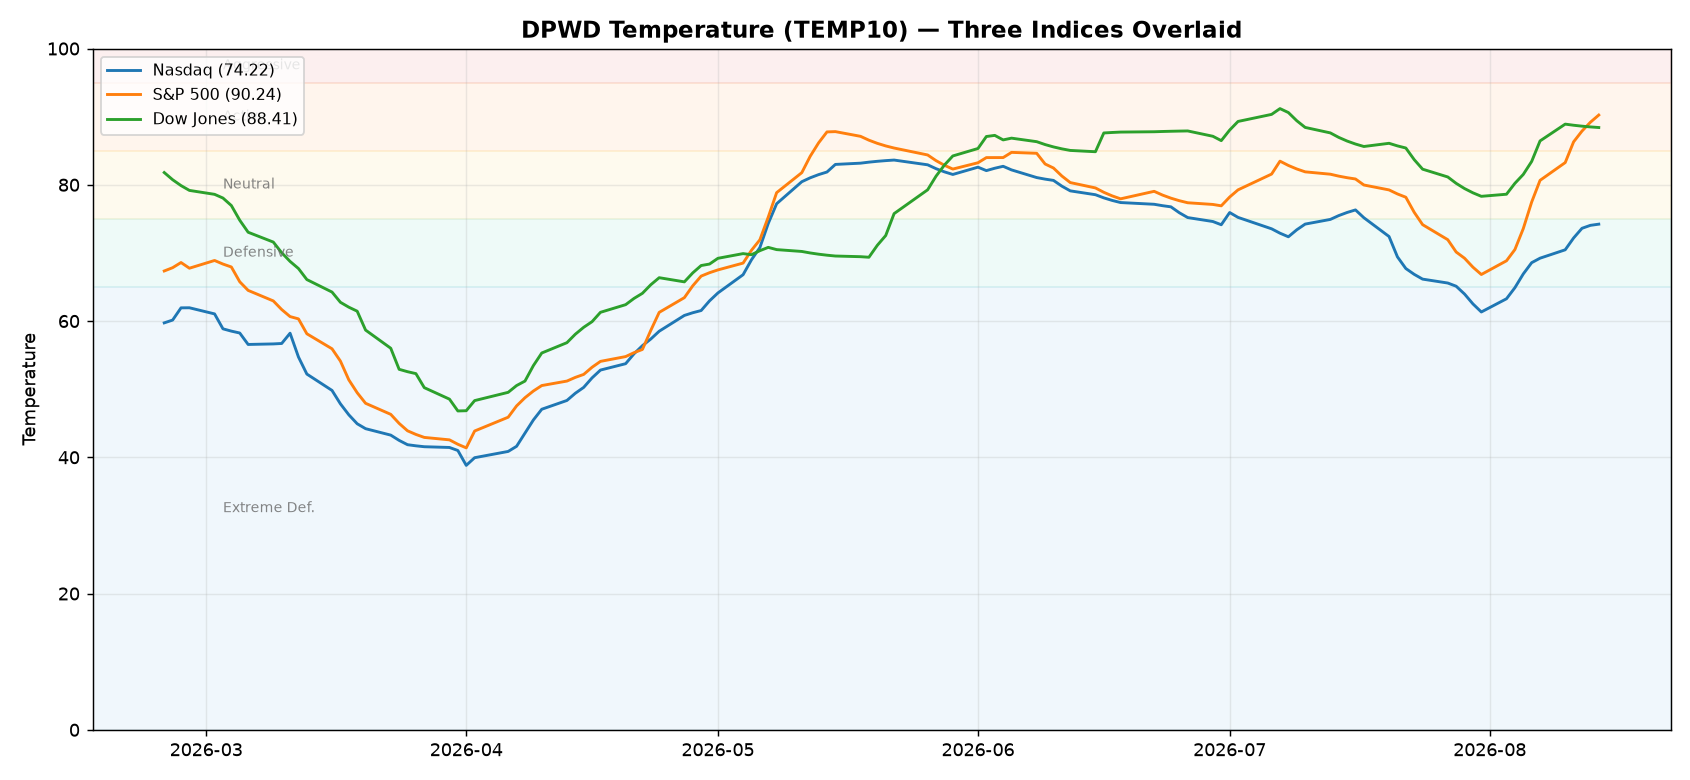
Figure 2 — 120-trading-day DPWD temperature trend (overlay).
| Index | Close | WD | TEMP10 | Zone |
|---|---|---|---|---|
| Nasdaq | 26,729.16 | 75.0 | 74.22 | Defensive |
| S&P 500 | 7,785.76 | 95.0 | 90.24 | Active |
| Dow Jones | 53,732.41 | 88.0 | 88.41 | Active |
The DPWD split is striking. The S&P 500 and Dow remain in the Active zone, but the Nasdaq sits in Defensive despite holding near its highs. That divergence says the headline index level is masking a less forgiving growth tape: capital is still working, but weak execution is being punished and leadership is narrowing.
The S&P’s 90.24 reading is the hottest of the three, consistent with broad index resilience and limited capitulation. The Nasdaq’s 74.22 is materially cooler, reflecting the churn across mega-cap technology and the violent $AMD-versus-$AVGO dispersion. This is an index market on the surface and a stock-picker’s tape underneath.
Index Technical Position
Nasdaq — high-level consolidation, cooler internal temperature. The Nasdaq closed at 26,729.16. Its 5-day moving average remains above the rising 20-day average, but the flattening short-term structure reflects a stalled 5-day return of only +0.14%. The nearest visible support is around 26,500, with 27,000 acting as the next round-number resistance. TEMP10 at 74.22 places the index in the Defensive zone, showing a cooler participation backdrop than the index level alone suggests.
S&P 500 — the strongest DPWD structure. The S&P 500 closed at 7,785.76, with the 5-day average still above the rising 20-day line and price pressing against the 7,800 resistance area. Initial support sits around 7,700, the nearby breakout and congestion zone. TEMP10 at 90.24 is firmly in the Active zone and close to its upper edge, consistent with an index still holding elevated participation rather than displaying broad de-risking.
Dow Jones — active temperature despite short-term slippage. The Dow finished at 53,732.41. Its 5-day average remains above the 20-day average, although the −0.56% weekly return shows that the shortest-term slope has softened. The nearest support is around 53,500, while 54,000 remains the immediate overhead marker. TEMP10 at 88.41 keeps the Dow in the Active zone, indicating that the recent pullback has not yet developed into a capitulation structure.
3. What the Market Is Trading
AI has shifted from basket exposure to execution gaps. Advanced Micro Devices, Inc.(AMD.US) surged +6.50% while Broadcom Limited(AVGO.US) sank −5.94%, an extraordinary 12.44-percentage-point one-day spread between two core AI names. NVIDIA Corporation(NVDA.US) , meanwhile, barely moved at −0.06%. The market is no longer treating every accelerator, ASIC and networking exposure as interchangeable. Product timing, financing structures, customer concentration and margin conversion now matter as much as top-line AI demand.
The infrastructure layer is outrunning consumer-facing mega-cap technology. NVIDIA Corporation(NVDA.US) gained +11.02% over 20 sessions and Microsoft Corporation(MSFT.US) advanced +25.79%, while Apple Inc.(AAPL.US) and Meta Platforms(META.US) lost −8.33% and −8.69%. The deeper logic is that the tape continues to reward companies tied directly to compute deployment, cloud capacity and monetizable enterprise workloads. Consumer hardware, advertising and platform narratives are seeing less automatic sponsorship.
The hyperscaler capex question is getting sharper. NVIDIA Corporation(NVDA.US) ’s reported $500 billion investment-mobilization framework has put partner financing and revenue-sharing structures in focus. The positive read is that more capital can unlock additional data-center capacity. The harder question is how much economic risk migrates back toward chip vendors and platform companies when customers require financing support. That debate is likely to drive increasingly company-specific multiples.
Energy is carrying geopolitical optionality. High pump prices and the prolonged Iran standoff keep crude-sensitive names on the radar. Peter Thiel’s disclosed 1% stake in Vista Energy adds a separate company-specific spotlight to Argentina’s Vaca Muerta shale exposure. The trade is not simply higher oil; it is the intersection of geopolitical scarcity, unconventional production growth and capital willing to underwrite non-U.S. resources.
Consumer and legacy-brand stress remains idiosyncratic rather than systemic. A historic retailer reportedly secured a lifeline after warning of potential collapse, while Disney’s challenge remains one of narrative momentum. These are reminders that an index near its highs can coexist with severe balance-sheet and execution pressure below the surface. The market is distinguishing between refinancing survival, genuine earnings recovery and a dead-cat bounce.
4. Sectors & Flows
| Name | Close | Day % | 5d % | 20d % | Note |
|---|---|---|---|---|---|
| Advanced Micro Devices, Inc.(AMD.US) | 514.39 | +6.50% | +6.42% | +3.76% | Accelerator bid; strongest one-day momentum |
| NVIDIA Corporation(NVDA.US) | 225.16 | −0.06% | +0.54% | +11.02% | Consolidating after a strong monthly run |
| Broadcom Limited(AVGO.US) | 392.99 | −5.94% | −8.13% | +5.98% | Sharp de-risking in AI networking and ASIC exposure |
| Microsoft Corporation(MSFT.US) | 495.40 | −0.30% | −0.92% | +25.79% | Cloud and AI winner digesting outsized gains |
| Amazon.com, Inc.(AMZN.US) | 262.65 | −0.94% | −4.31% | +6.24% | Near-term cloud and consumer rotation pressure |
| Apple Inc.(AAPL.US) | 305.93 | +0.22% | −2.36% | −8.33% | Stabilizing after persistent monthly weakness |
| Meta Platforms(META.US) | 589.85 | −0.86% | −0.38% | −8.69% | Capex and monetization debate remains unresolved |
| Tesla Motors, Inc.(TSLA.US) | 342.27 | +0.68% | +4.17% | −10.13% | Short-term bounce inside a weaker monthly structure |
| Alphabet Inc. Class A(GOOGL.US) | 345.90 | −0.13% | −2.37% | −0.25% | Range-bound as AI competition complicates the rerating |
| Flow | Sector / Names | Signal |
|---|---|---|
| Concentrated inflow | Advanced Micro Devices, Inc.(AMD.US) , NVIDIA Corporation(NVDA.US) , Microsoft Corporation(MSFT.US) | Capital remains available for identifiable AI winners |
| Fast de-risking | Broadcom Limited(AVGO.US) | Crowded AI exposure is vulnerable when execution expectations reset |
| Profit digestion | Microsoft Corporation(MSFT.US) , Amazon.com, Inc.(AMZN.US) | Strong monthly winners are meeting shorter-term rotation |
| Weak sponsorship | Apple Inc.(AAPL.US) , Meta Platforms(META.US) , Tesla Motors, Inc.(TSLA.US) | Large-cap status is not enough to offset earnings or narrative gaps |
| Event-driven interest | Vista Energy, broader energy | Geopolitics and Vaca Muerta exposure are attracting incremental attention |
| Distressed selectivity | Legacy retail | Financing headlines can produce relief rallies without resolving operating stress |
5. Key Catalysts This Week
AI financing economics. The tape is likely to keep parsing the mechanics behind NVIDIA Corporation(NVDA.US) ’s $500 billion investment mobilization: partner funding, revenue sharing, customer credit quality and the timing of infrastructure conversion into chip revenue.
Semiconductor readthroughs. Accelerator demand remains strong, but the market is separating GPUs, custom ASICs, optical networking, memory and semiconductor equipment. $AMD’s +6.50% move and $AVGO’s −5.94% drop have raised the bar for clean execution across the chain.
Networking and enterprise demand. Cisco’s demand momentum and forward-year guidance framework offer a check on whether enterprise networking can keep pace with AI-led data-center spending. Optical suppliers such as Coherent and Lumentum remain relevant readthroughs for bandwidth demand and component bottlenecks.
Oil and Iran headlines. Pump-price sensitivity keeps geopolitical developments connected to both energy equities and consumer sentiment. The key market signal is whether higher crude produces durable energy leadership or merely another headline-driven spike.
Consumer balance-sheet fractures. Retail refinancing stories, subsidy sensitivity and pressure on discretionary spending remain worth tracking. So far, the evidence points to name-specific stress rather than broad consumer capitulation, but dispersion is widening.
6. Institutions & Research
AI capex: sustainability is now the question. Goldman Sachs analysts see continued strength across AI servers, GPUs, ASICs and optical networking, with Marvell positioned to benefit from data-center upside tied to optical demand and custom-silicon ramps. Their work on Nvidia centers on partner financing and the shape of the Rubin ramp, highlighting that investors are moving beyond raw demand and toward funding quality, product cadence and revenue conversion.
The supply chain still shows real operating leverage. Goldman’s analysis of Hon Hai points to continuing GPU and ASIC server ramps, while its Applied Materials view frames strong guidance as a setup for accelerating growth into 2027. The common thread is that AI spending is propagating through assembly, equipment and connectivity rather than remaining confined to accelerator vendors.
Neocloud demand is robust, but expansion risk matters. Morgan Stanley sees a strong demand backdrop for neocloud infrastructure and software, with Cerebras and CoreWeave part of the broader capacity build-out. Citi’s work on Nebius similarly emphasizes commercial momentum while acknowledging investor concern around expansion requirements. The market’s next filter is whether utilization and contracted revenue can outrun depreciation, financing and build costs.
Optical networking remains a high-conviction bottleneck trade with policy risk. Citi’s discussions with Coherent and Lumentum management point toward sustained interest in high-speed connectivity, while Goldman highlights debates around possible U.S. import restrictions affecting Chinese optical transceiver modules. UBS’s work on Zhongji Innolight reinforces the importance of transceivers within the AI cluster. Demand is visible, but trade policy and supply-chain substitution can reshape where the economics land.
Enterprise networking faces a high guidance bar. JPMorgan argues that Cisco’s demand momentum appears strong, but expectations for fiscal 2027 leave limited room for a merely in-line outlook. That setup mirrors the broader tape: solid end demand is no longer sufficient when valuations already discount acceleration.
Memory and custom silicon are moving deeper into the AI stack. Goldman and BofA highlight SanDisk’s financial targets, capital-return potential and optionality around high-bandwidth flash. Morgan Stanley’s work on advanced-node ASIC programs, including 3-nanometer Trainium-related ramps, shows hyperscalers pushing harder into custom compute as memory constraints and supernode architecture become more important.
Flows are becoming less forgiving. BofA’s flow framework fits the observed price action: capital remains concentrated in secular AI beneficiaries, while crowded positions can unwind violently when the earnings path disappoints. The 12.44-percentage-point daily gap between $AMD and $AVGO is a clean example of picking names replacing the old “own the whole basket” playbook.
7. Signals Worth Tracking
- Nasdaq breadth versus index level: TEMP10 at 74.22 remains Defensive even with the index only 1.01% below 27,000.
- S&P congestion: 7,800 is the immediate ceiling, while 7,700 marks the nearest support zone.
- Dow participation: TEMP10 at 88.41 remains Active despite a −0.56% five-day return.
- Advanced Micro Devices, Inc.(AMD.US) versus Broadcom Limited(AVGO.US) : the 12.44-percentage-point one-day divergence is a live measure of how aggressively the market is differentiating AI exposures.
- NVIDIA Corporation(NVDA.US) near-term digestion: the stock is up +11.02% over 20 sessions but only +0.54% over 5, showing momentum consolidation rather than broad semiconductor capitulation.
- Mega-cap divergence: Microsoft Corporation(MSFT.US) ’s +25.79% monthly gain contrasts with $AAPL at −8.33%, $META at −8.69% and $TSLA at −10.13%.
- Oil-to-consumer transmission: persistent pump-price pressure would connect the geopolitical tape to discretionary demand and inflation expectations.
- Distressed-retail rallies: price spikes tied to financing lifelines remain distinct from evidence of durable operating recovery.
Market data from public market sources; research views from sell-side and public reporting.