

US Market Pulse | Nasdaq Falls into the Defensive Zone, TSLA Gains +6.02% for the Week, Major Banks Keep a Close Eye on NVDA and AVGO (Week Ending August 21)
Tesla Motors, Inc. TSLA | 0.00 | |
NVIDIA Corporation NVDA | 0.00 | |
Broadcom Limited AVGO | 0.00 | |
Advanced Micro Devices, Inc. AMD | 0.00 | |
Microsoft Corporation MSFT | 0.00 |
This is a weekly framework as of the US market close. Objective description only — not investment advice. Markets carry risk; please do your own diligence.
1. Market Snapshot
Friday produced a bounce, but not a clean risk-on reset. The Dow Jones gained +0.98%, while the S&P 500 and Nasdaq each added +0.43%. All three still closed lower for the week: Nasdaq −2.05%, S&P 500 −1.43%, and Dow −0.85%. The tape looked more like selective short covering after de-risking than broad capitulation followed by a durable rebound.
Under the hood, Tesla Motors, Inc.(TSLA.US) was the standout at $362.86, up +5.14% Friday and +6.02% over five sessions. AI semis remained heavy: NVIDIA Corporation(NVDA.US) lost −4.64% for the week, Broadcom Limited(AVGO.US) fell −6.24%, and Advanced Micro Devices, Inc.(AMD.US) dropped −8.00%. Microsoft Corporation(MSFT.US) 's +26.60% twenty-day gain still marks it as the strongest megacap trend in the group, while Apple Inc.(AAPL.US) , Meta Platforms(META.US) , Broadcom Limited(AVGO.US) , and Advanced Micro Devices, Inc.(AMD.US) all carry negative twenty-day returns.
| Benchmark / Name | Close | Day % | 5d % | 20d % |
|---|---|---|---|---|
| Nasdaq | 26,180.46 | +0.43% | −2.05% | +4.82% |
| S&P 500 | 7,674.37 | +0.43% | −1.43% | +3.54% |
| Dow Jones | 53,277.01 | +0.98% | −0.85% | +2.56% |
| NVIDIA Corporation(NVDA.US) | $214.72 | −0.98% | −4.64% | +3.81% |
| Tesla Motors, Inc.(TSLA.US) | $362.86 | +5.14% | +6.02% | +15.92% |
| Broadcom Limited(AVGO.US) | $368.45 | +1.21% | −6.24% | −3.53% |
| Advanced Micro Devices, Inc.(AMD.US) | $473.25 | +0.81% | −8.00% | −9.33% |
🔔 Subscribe to The Trend Catcher Topic / The Value Anchor Topic
The Trend Catcher / The Value Anchor — unlock the full historical archive and never miss a weekly pick again.
2. DPWD Temperature Gauge & Index Position
DPWD is our original gauge built on three objective technical factors: moving average, MACD and RSI. Its readings reflect market temperature. Zones: ≥95 Aggressive / 85–95 Active / 75–85 Neutral / 65–75 Defensive / <55 Extremely Defensive. Chart window: last 120 trading days (calculations use full history).
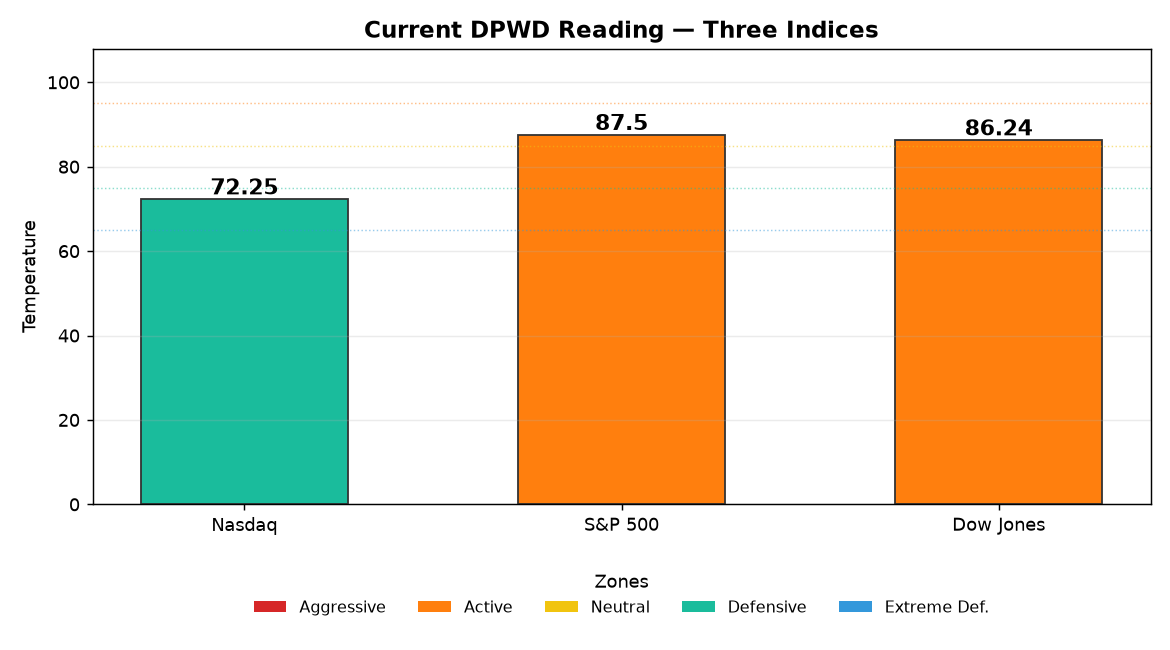
Figure 1 — DPWD temperature reading across the three major indices (TEMP10).
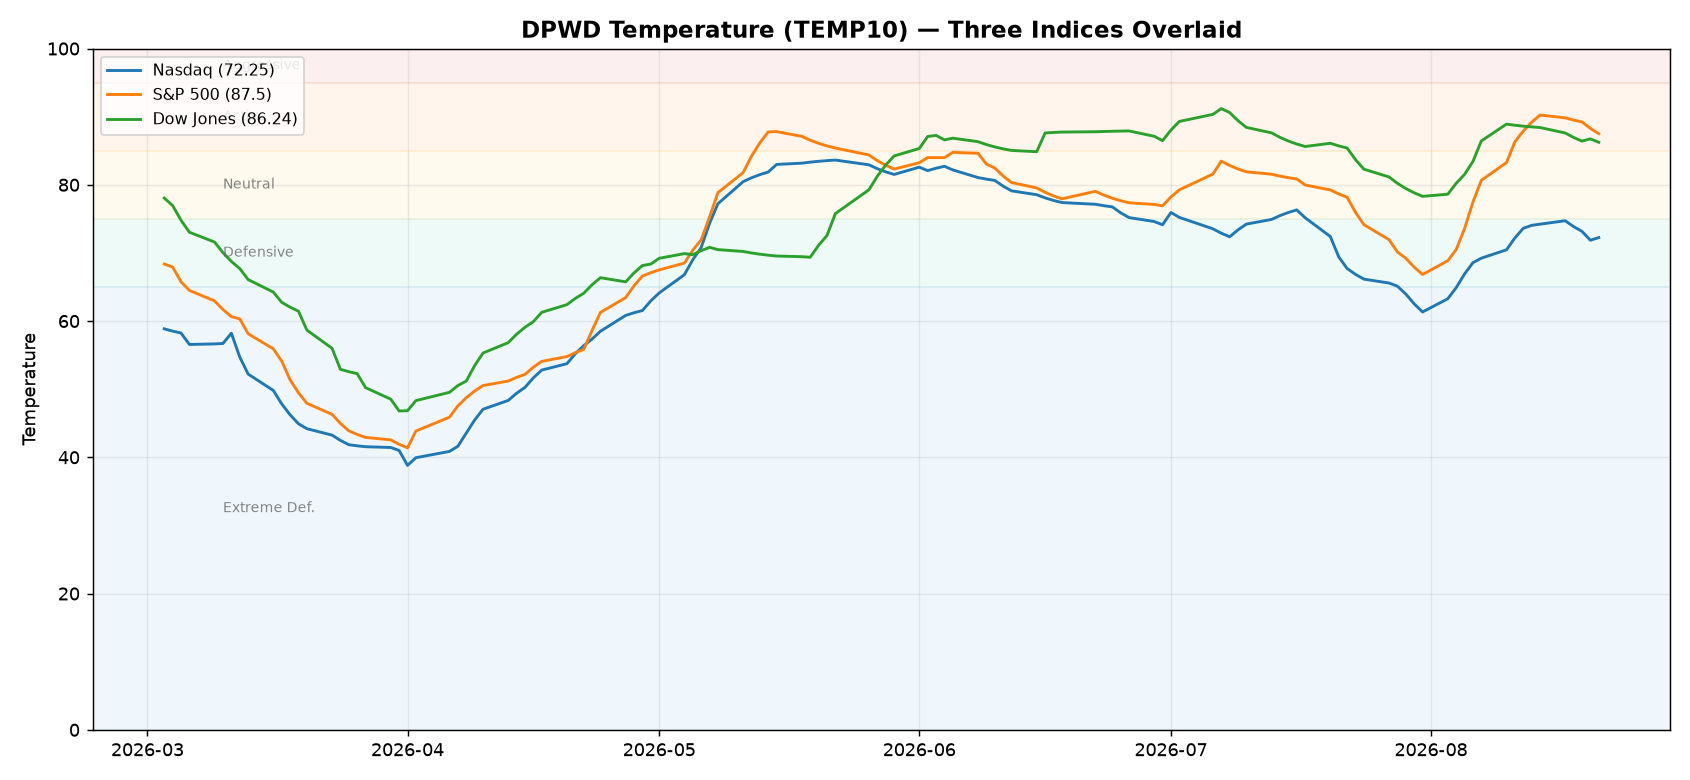
Figure 2 — 120-trading-day DPWD temperature trend (overlay).
| Index | Close | WD | TEMP10 | Zone |
|---|---|---|---|---|
| Nasdaq | 26,180.46 | 74.0 | 72.25 | Defensive |
| S&P 500 | 7,674.37 | 84.0 | 87.50 | Active |
| Dow Jones | 53,277.01 | 84.0 | 86.24 | Active |
The DPWD split captures the tape's main divergence. Nasdaq has slipped into the Defensive zone with TEMP10 at 72.25, reflecting the week's pressure in NVIDIA Corporation(NVDA.US) , Broadcom Limited(AVGO.US) , Advanced Micro Devices, Inc.(AMD.US) , and Meta Platforms(META.US) . The S&P 500 and Dow remain in the Active zone at 87.50 and 86.24, respectively, as non-tech exposure and the Dow's stronger Friday close cushion the index-level damage.
That is not a synchronized risk regime. The market is still picking names, with capital rotating rather than leaving equities wholesale. Friday's rebound improved the close, but it did not erase the weekly drawdown or repair the short-term semiconductor structure.
Index Technical Position
Nasdaq — short-term momentum remains the weakest of the three. The index closed at 26,180.46, with the 5-day average rolling below the 10-day average after a −2.05% week. The nearest visible support is the 26,000 round-number area, while 26,500 is the first overhead congestion zone. TEMP10 at 72.25 places Nasdaq in the Defensive zone, consistent with a cooling growth and semiconductor tape rather than outright capitulation.
S&P 500 — the broader index is holding a firmer structure. The close at 7,674.37 leaves the index near its short-term moving-average cluster, with the 5-day average softening against the 10-day line but the broader trend still supported by a +3.54% twenty-day return. The nearest support sits around 7,600, while 7,700 is the immediate resistance area. TEMP10 at 87.50 remains in the Active zone, showing that index participation has cooled without dropping into the Nasdaq's defensive regime.
Dow Jones — relative strength is coming from the non-tech side of the board. The Dow finished at 53,277.01, and its 5-day and 10-day averages remain more tightly grouped than Nasdaq's after Friday's +0.98% move. The 53,000 area is the nearest support, with resistance around 53,500. TEMP10 at 86.24 is still in the Active zone, matching the Dow's smaller −0.85% weekly decline and stronger closing bid.
3. What the Market Is Trading
The NVIDIA Corporation(NVDA.US) earnings bar is high, and positioning already knows it. NVDA closed at $214.72, down −0.98% Friday and −4.64% for the week. The market is not merely trading the next quarter; it is trading the handoff from current accelerators into the Rubin cycle, the durability of hyperscaler spending, and whether supply expansion can sustain growth without compressing margins. With expectations elevated, the reaction function may matter more than the headline beat.
AI semis are being de-risked ahead of validation. Broadcom Limited(AVGO.US) fell −6.24% over five sessions and Advanced Micro Devices, Inc.(AMD.US) dropped −8.00%, even though both bounced on Friday. Broadcom Limited(AVGO.US) 's setup centers on fiscal 2027 AI revenue, custom-ASIC competition, and networking demand. Advanced Micro Devices, Inc.(AMD.US) 's −9.33% twenty-day return shows a deeper momentum break. This is a valuation and expectations reset across the AI complex, not just single-name noise.
$TSLA is trading its own tape. Tesla Motors, Inc.(TSLA.US) 's +5.14% Friday surge lifted its weekly return to +6.02% and its twenty-day move to +15.92%. That sharply diverges from the semiconductor unwind and from weakness in several megacaps. The deeper logic is factor rotation: traders are picking high-beta stories with independent catalysts rather than treating growth as one crowded basket.
Trade friction is returning as a sector filter. The prospect of a broader U.S.-Canada trade conflict puts autos, industrial inputs, agriculture, lumber, transportation, and cross-border retailers in focus. Canada is a deeply integrated production partner, so additional tariffs would feed through supply chains rather than remain isolated to headline trade figures. The tape is likely to distinguish between companies with domestic pricing power and those carrying cross-border cost exposure.
Megacap leadership is fragmented. Microsoft Corporation(MSFT.US) remains up +26.60% over twenty sessions, while Apple Inc.(AAPL.US) is down −7.11% and Meta Platforms(META.US) is down −7.61% over the same window. Alphabet Inc. Class A(GOOGL.US) gained +1.22% Friday and retains a +7.84% twenty-day advance. The market is trading earnings durability and AI monetization name by name, with the old all-megacaps-up-together playbook no longer describing the tape.
4. Sectors & Flows
| Name | Close | Day % | 5d % | 20d % | Note |
|---|---|---|---|---|---|
| Apple Inc.(AAPL.US) | $309.35 | −0.63% | +1.12% | −7.11% | Weekly stabilization inside a weaker monthly structure |
| NVIDIA Corporation(NVDA.US) | $214.72 | −0.98% | −4.64% | +3.81% | Pre-earnings de-risking; expectations remain elevated |
| Microsoft Corporation(MSFT.US) | $483.24 | +0.43% | −2.45% | +26.60% | Strongest twenty-day megacap trend |
| Amazon.com, Inc.(AMZN.US) | $258.63 | −0.57% | −1.53% | +11.43% | AWS and AI-capex debate remains central |
| Alphabet Inc. Class A(GOOGL.US) | $344.82 | +1.22% | −0.31% | +7.84% | Friday strength, limited weekly damage |
| Meta Platforms(META.US) | $549.90 | +0.75% | −6.77% | −7.61% | Sharp weekly drawdown despite Friday bounce |
| Tesla Motors, Inc.(TSLA.US) | $362.86 | +5.14% | +6.02% | +15.92% | High-beta relative-strength outlier |
| Broadcom Limited(AVGO.US) | $368.45 | +1.21% | −6.24% | −3.53% | AI revenue and ASIC expectations being reset |
| Advanced Micro Devices, Inc.(AMD.US) | $473.25 | +0.81% | −8.00% | −9.33% | Weakest semiconductor momentum in the group |
| Flow | Sector / Names | Signal |
|---|---|---|
| De-risking | AI semis: NVDA, AVGO, AMD | Broad weekly drawdowns ahead of major earnings and guidance checks |
| Relative-strength rotation | TSLA | Positive across the daily, weekly, and twenty-day windows |
| Selective megacap support | MSFT, GOOGL, AMZN | Longer-term gains remain intact despite a softer week |
| Distribution | META, AAPL | Negative twenty-day returns indicate fading leadership |
| Defensive broadening | Dow-linked industrial and value exposure | Dow outperformed Nasdaq on both Friday and the week |
| Event positioning | DELL and hardware infrastructure | Earnings focus is shifting toward AI-server demand and order conversion |
5. Key Catalysts This Week
NVIDIA Corporation(NVDA.US) results are the center of gravity. The key variables are data-center growth, accelerator supply, gross margins, customer concentration, and commentary on the Rubin product cycle. NVIDIA Corporation(NVDA.US) 's −4.64% weekly move shows that some risk has already been taken off, but it also leaves the wider AI complex exposed to the quality of guidance.
Dell earnings test whether AI infrastructure demand is converting into profit. DELL enters the event with renewed sell-side attention. Traders are likely to separate headline AI-server orders from backlog conversion, component costs, margins, and free-cash-flow delivery.
Jackson Hole puts the rates path back into the equity multiple. The market will parse the balance between inflation control, labor-market resilience, and the timing of any policy adjustment. Long-duration technology remains especially sensitive to changes in real yields, while banks and cyclicals carry a different rate exposure.
U.S.-Canada trade tension introduces weekend-gap risk. Autos, industrials, materials, railroads, agriculture, lumber, and consumer goods with integrated North American supply chains carry the clearest sensitivity. The relevant signal is whether tariff rhetoric stays political or starts appearing in corporate cost and pricing assumptions.
Media consolidation remains a special-situations trade. Potential California scrutiny around television-channel divestitures tied to Paramount-Warner adds regulatory complexity. Price action in the group is likely to track deal structure and required asset sales rather than the broader index tape.
6. Institutions & Research
AI capex remains strong, but the market is demanding proof of returns. Citi analysts see robust AI-driven demand across North American hardware, storage, and neocloud infrastructure, while also noting that expectations entering earnings are already high. Goldman analysts similarly frame the debate around whether cloud acceleration and visible AI-capex returns can translate into an earnings inflection rather than just higher spending.
NVIDIA Corporation(NVDA.US) 's next product cycle is becoming part of today's valuation. Morgan Stanley argues that semiconductor growth remains strong even before the Rubin cycle contributes fully. That raises the bar for the current earnings setup: investors are assessing not only near-term accelerator shipments, but also the continuity of demand across product transitions and the margin profile attached to the next architecture.
Broadcom Limited(AVGO.US) is a custom-silicon and networking test, not simply another chip print. Goldman analysts expect attention to stay on fiscal 2027 AI revenue, guidance quality, and competition in custom ASICs. AVGO's −6.24% weekly decline indicates that the tape has started discounting a less forgiving expectations setup even as long-term AI infrastructure demand remains a central thesis.
Memory economics are moving deeper into the AI stack. JPMorgan highlights the role of long-term agreements in supporting visibility for flash-memory economics, while UBS and BofA research focuses on the improving memory backdrop and AI-related demand. The market is tracking whether tighter supply discipline and high-value products can sustain margins as capacity responds.
Optical modules and interconnects are broadening the infrastructure trade. UBS's team sees next-generation optical architecture, including 3.2T solutions and near-packaged optics, becoming a larger revenue contributor over time. Citi and Goldman also emphasize optical communication, copper interconnects, data-center components, and electronics manufacturing as second-order beneficiaries of AI deployment.
Crowding is becoming a material market variable. BofA's fund-manager work shows technology retaining top status while defensive interest rises and cash allocations sit at low levels. That combination describes a market with substantial equity exposure but less room for disappointment. It helps explain why strong secular stories can still undergo sharp de-risking when earnings bars become stretched.
Cloud platforms are being judged on monetization pathways. Morgan Stanley's work on AWS emphasizes the scale of the long-term cloud revenue opportunity, while Goldman sees accelerating cloud demand and stronger AI-capex return visibility at major platforms. The common thread is that infrastructure spending alone is no longer enough; investors are looking for utilization, pricing power, and operating leverage.
7. Signals Worth Tracking
- Nasdaq at 26,000: The 26,000 area is the nearest round-number support after the index entered the DPWD Defensive zone.
- S&P 500 at 7,700: A sustained move through the 7,700 congestion area would show whether Friday's bounce is gaining broader participation or remaining a dead-cat bounce.
- Dow versus Nasdaq: Continued Dow relative strength would reinforce the rotation toward industrial, value, and less duration-sensitive exposure.
- NVDA's post-earnings reaction: The gap between reported growth and the stock's reaction will reveal how much optimism was already embedded.
- Semiconductor breadth: NVIDIA Corporation(NVDA.US) , Broadcom Limited(AVGO.US) , and Advanced Micro Devices, Inc.(AMD.US) moving together would signal a factor-level AI trade; divergence would point back toward stock picking.
- Tesla Motors, Inc.(TSLA.US) relative strength: TSLA's +6.02% weekly and +15.92% twenty-day gains remain a clean contrast with the semiconductor unwind.
- TEMP10 convergence: Nasdaq at 72.25 versus the S&P 500 at 87.50 and Dow at 86.24 is the key regime split. A narrowing gap would indicate that market internals are becoming more synchronized.
- Trade-sensitive sectors: Autos, industrial inputs, rails, agriculture, and cross-border retailers are the first places where U.S.-Canada tariff escalation may appear in price action.
- Real yields and megacap duration: Microsoft Corporation(MSFT.US) 's +26.60% twenty-day gain leaves it more sensitive to any rate-driven multiple compression than weaker megacap peers.
Market data from public market sources; research views from sell-side and public reporting.