

V2X (VVX) Is Up 10.5% After Broad S&P Index Additions Has The Bull Case Changed?
V2X Inc VVX | 0.00 |
- On 20 July 2026, V2X, Inc. (NYSE: VVX) was added to several S&P benchmarks, including the S&P 600, S&P 1000, S&P 600 Industrials, and the S&P Composite 1500, cementing its place among widely tracked U.S. small-cap and industrial companies.
- This broad index inclusion can increase the company’s visibility among institutional and retail investors, as index-tracking funds and benchmark-aware portfolios may need to incorporate V2X into their holdings.
- We’ll now examine how V2X’s broad S&P index inclusion could influence its investment narrative built around defense demand and contract wins.
Find 50 companies with promising cash flow potential yet trading below their fair value.
V2X Investment Narrative Recap
To own V2X, you need to believe that rising defense demand, a large contract pipeline, and improving execution can offset lumpier government awards and modest margins. The broad S&P index inclusion mainly affects trading and visibility rather than these fundamentals; it may modestly support liquidity but does not remove the key near term risk that large, episodic contract wins could be delayed or challenged, leaving book to bill and backlog under pressure.
The most relevant recent announcement is V2X’s May 2026 guidance raise, lifting full year revenue expectations to US$4,825 million to US$4,975 million. That update underlined management’s confidence in existing awards and near term execution, which sits in contrast to the ongoing risk around protest prone, fixed price contract exposure. Index inclusion now puts more eyes on whether V2X can translate that higher guidance and contract momentum into sustained backlog replenishment and margin improvement.
Yet while the index news may look purely positive, investors should still be aware of how dependent V2X remains on a handful of large government contracts...
V2X's narrative projects $5.5 billion revenue and $196.9 million earnings by 2029. This requires 5.1% yearly revenue growth and about a $108 million earnings increase from $88.7 million today.
Uncover how V2X's forecasts yield a $79.42 fair value, a 5% downside to its current price.
Exploring Other Perspectives
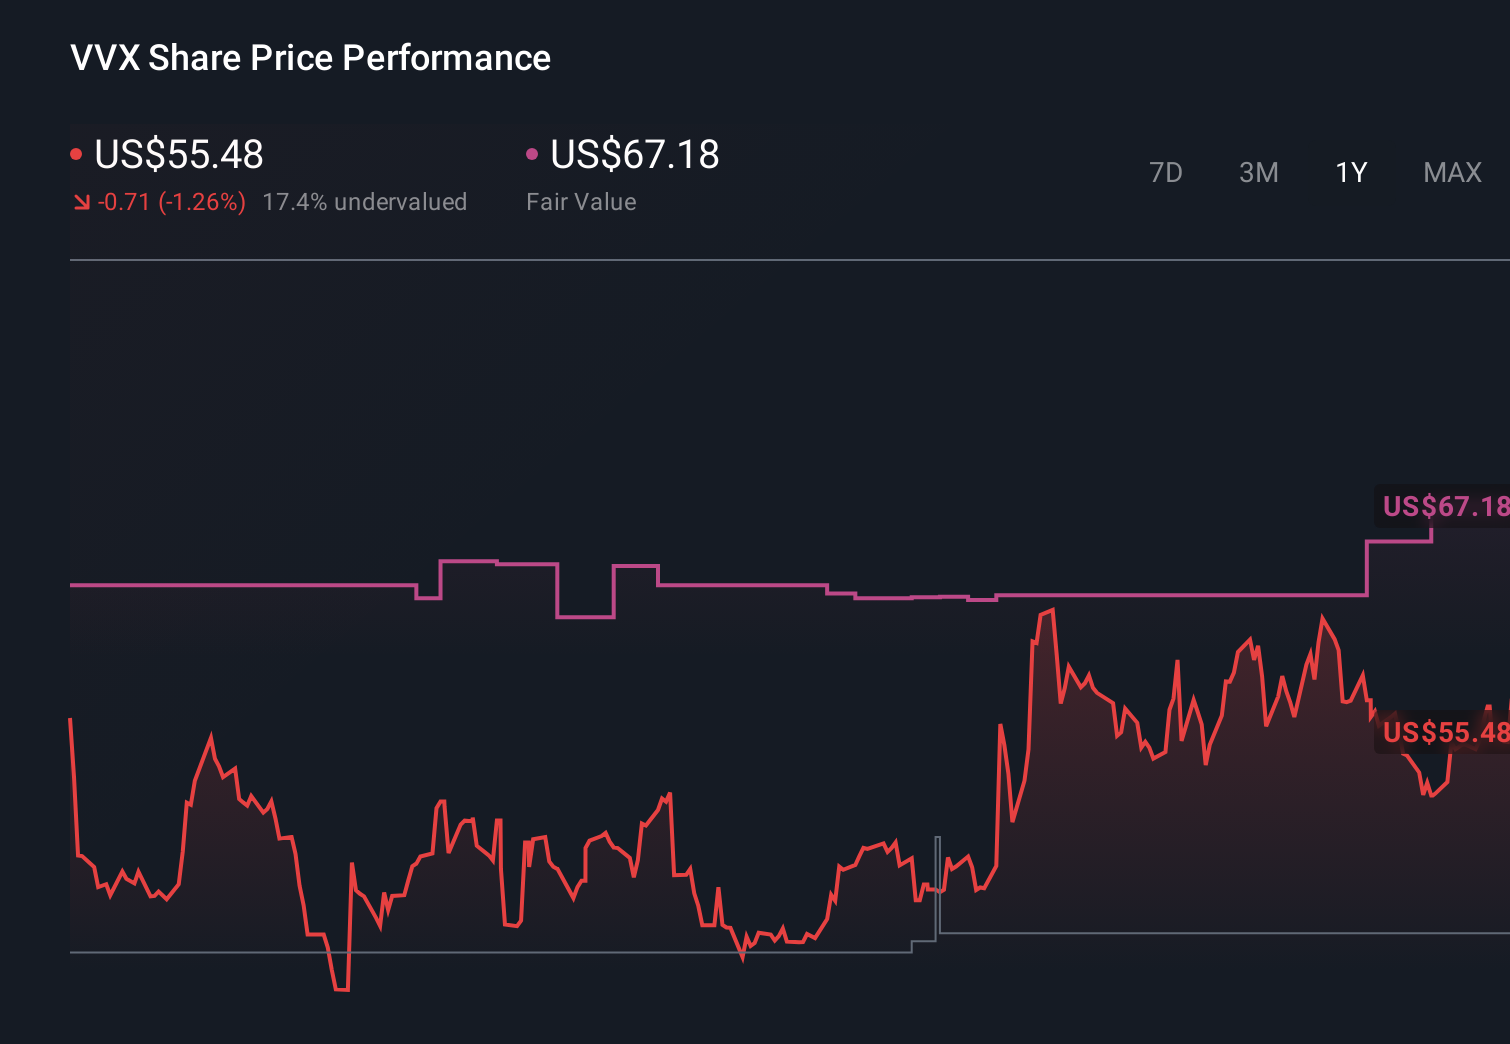
Some of the most optimistic analysts were already assuming V2X could reach about US$5.7 billion of revenue and US$249 million of earnings by 2029, so you should weigh this upbeat view on award momentum against the concentration and protest risk those same contracts carry, and consider how this new index inclusion might shift those expectations in either direction.
Explore 4 other fair value estimates on V2X - why the stock might be worth over 2x more than the current price!
The Verdict Is Yours
Disagree with existing narratives? Extraordinary investment returns rarely come from following the herd, so go with your instincts.
- A great starting point for your V2X research is our analysis highlighting 4 key rewards and 1 important warning sign that could impact your investment decision.
- Our free V2X research report provides a comprehensive fundamental analysis summarized in a single visual - the Snowflake - making it easy to evaluate V2X's overall financial health at a glance.
Looking For Alternative Opportunities?
Our daily scans reveal stocks with breakout potential. Don't miss this chance:
- We've uncovered the 9 dividend fortresses yielding 5%+ that don't just survive market storms, but thrive in them.
- The future of work is here. Discover the 34 top robotics and automation stocks leading the charge in AI-driven automation and industrial transformation.
- Uncover the next big thing with 20 elite penny stocks that balance risk and reward.
This article by Simply Wall St is general in nature. We provide commentary based on historical data and analyst forecasts only using an unbiased methodology and our articles are not intended to be financial advice. It does not constitute a recommendation to buy or sell any stock, and does not take account of your objectives, or your financial situation. We aim to bring you long-term focused analysis driven by fundamental data. Note that our analysis may not factor in the latest price-sensitive company announcements or qualitative material. Simply Wall St has no position in any stocks mentioned.