Verizon Communications (VZ) Margin Surge To 14.4% Tests Bearish Profitability Narratives
Verizon Communications Inc. VZ | 49.40 | +0.02% |
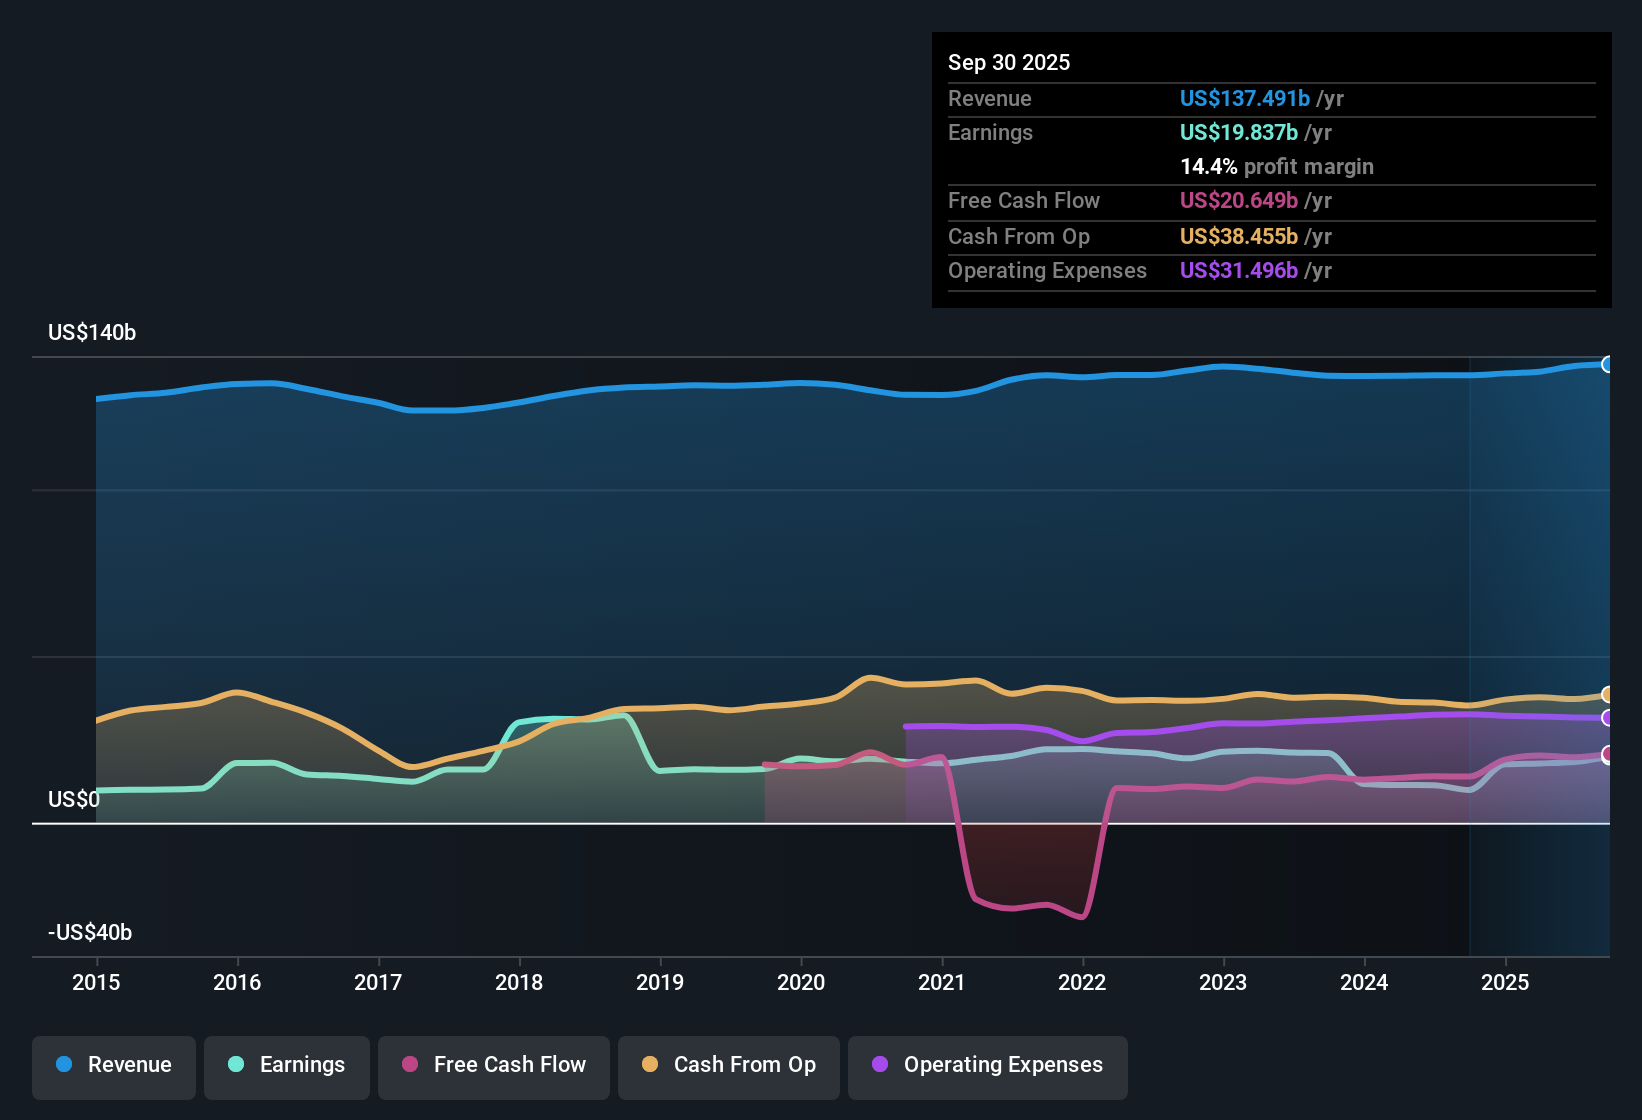
Verizon Communications (VZ) just posted its FY 2025 third quarter numbers, with revenue at US$33.8b, basic EPS of US$1.17 and net income excluding extra items of US$4.9b. The company has seen quarterly revenue move from US$33.3b in Q3 2024 to US$33.8b in Q3 2025, while basic EPS over the same quarters went from US$0.78 to US$1.17. This gives investors a clear read on how the top line and EPS have tracked over the past year. With trailing 12 month net profit margin reported at 14.4% versus 7.3% the prior year, the latest results present a cleaner, more profitable earnings profile for shareholders to weigh.
See our full analysis for Verizon Communications.With the headline numbers on the table, the next step is to see how this earnings profile lines up with the most widely held narratives around Verizon and where the story the numbers tell starts to differ.
Margins Double To 14.4%
- Over the last 12 months, Verizon’s net profit margin is 14.4%, compared with 7.3% in the prior year, on trailing revenue of about US$137.5b and net income excluding extra items of about US$19.8b.
- What stands out for the bullish view is that higher recent margin quality sits next to a five year pattern of earnings declining at about 6.6% a year, so:
- Trailing 12 month earnings are about US$19.8b with Basic EPS of US$4.70, while a year earlier the dataset shows net income of about US$9.8b and EPS of US$2.32, a very large year over year lift that bulls may see as support for a cleaner profit base.
- At the same time, the long run earnings decline means bulls still have to reconcile this stronger recent margin with that multi year track record when they think about how durable this profitability might be.
TTM Revenue Only Growing 2.5%
- On a trailing 12 month basis, revenue is about US$137.5b, which is tied to a 2.5% yearly revenue growth rate in the data, showing that most of the recent earnings lift came with only modest top line expansion.
- Critics focusing on the bearish angle often point out that such 2.5% revenue growth and forecast earnings growth of about 3.9% a year limit the scope for a big re rating, and:
- With Q3 2025 revenue at US$33.8b versus US$33.3b in Q3 2024, the year on year change is modest, which bears can use to argue that the business is leaning more on efficiency than on strong demand growth.
- The same data shows trailing 12 month EPS at US$4.70 against an estimated 3.9% forward growth rate, so bears may question how much higher profitability can go if revenue only edges up at a similar pace.
P/E Of 9.5x With 6.2% Yield
- Verizon trades on a P/E of 9.5x at a share price of US$44.52, above a 5.2x peer average but below the 16.4x Global Telecom average, and it carries a 6.2% dividend yield while a DCF fair value of about US$105.01 per share in the data sits well above the current price.
- Supporters of the bullish case point to this mix of income and modelled upside, yet the same dataset flags high debt as a risk, so:
- The gap between the DCF fair value of about US$105.01 and the current US$44.52 level is more than 2x, which some bulls may read as a potential valuation cushion even though it is only one model output.
- At the same time, the P/E premium to peers at 9.5x versus 5.2x and the high leverage figure in the risk summary give bears a concrete reason to argue that investors are already paying up relative to closer comparables.
Next Steps
Don't just look at this quarter; the real story is in the long-term trend. We've done an in-depth analysis on Verizon Communications's growth and its valuation to see if today's price is a bargain. Add the company to your watchlist or portfolio now so you don't miss the next big move.
See What Else Is Out There
Verizon pairs a modest 2.5% revenue growth rate with a P/E premium to peers and a high debt flag in the risk summary.
If that mix of slow top line growth and leverage gives you pause, use our CTA_SCREENER_SOLID_BALANCE_SHEET to quickly focus on companies built on healthier balance sheets.
This article by Simply Wall St is general in nature. We provide commentary based on historical data and analyst forecasts only using an unbiased methodology and our articles are not intended to be financial advice. It does not constitute a recommendation to buy or sell any stock, and does not take account of your objectives, or your financial situation. We aim to bring you long-term focused analysis driven by fundamental data. Note that our analysis may not factor in the latest price-sensitive company announcements or qualitative material. Simply Wall St has no position in any stocks mentioned.